
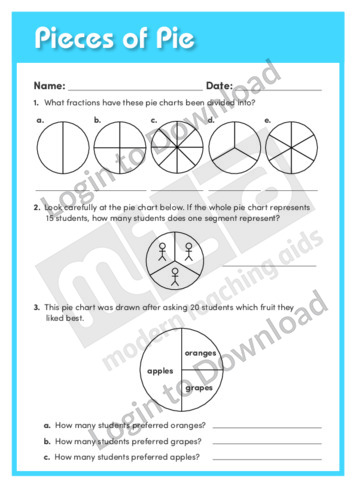
This data representation worksheet, ‘Pieces of Pie’ asks students to practise interpreting pie charts.
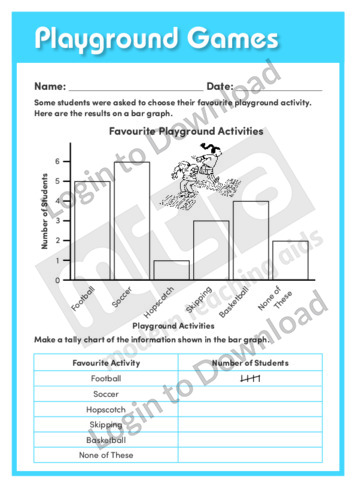
This data representation worksheet, ‘Playground Games’ asks students to practise creating tallys from bar graphs.
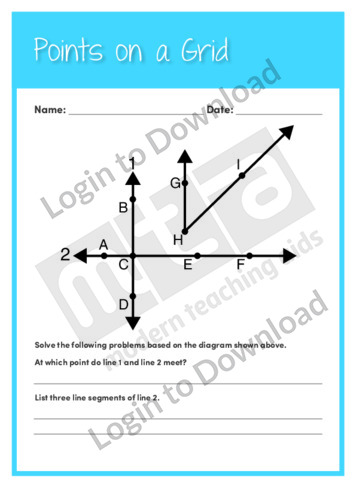
This measurement worksheet, ‘Points on a Grid’ allows for practice reading points on a grid. Answer sheet provided with file download.
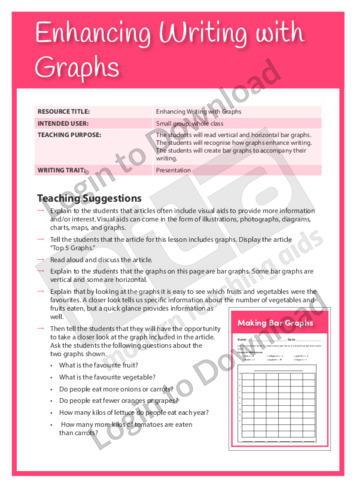
This Writing Traits activity ‘Enhancing Writing with Graphs’ encourages students to read and create vertical and horizontal bar graphs and recognise how they enhance writing.
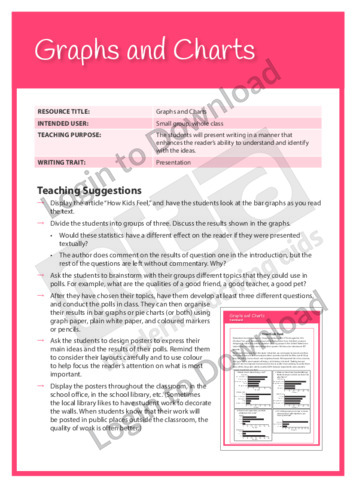
This Writing Traits activity ‘Graphs and Charts’ encourages students to present writing in a manner that enhances the reader’s ability to understand and identify the ideas.
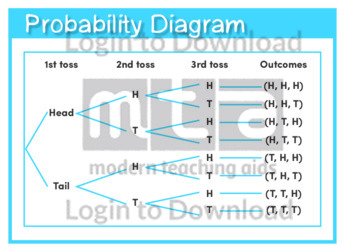
This quick reference chart, ‘Probability Diagram’ can be reproduced for classroom use.
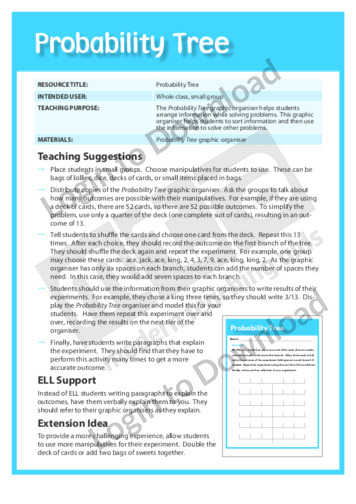
This graphic organiser, ‘Probability Tree’ helps students arrange information while solving problems.
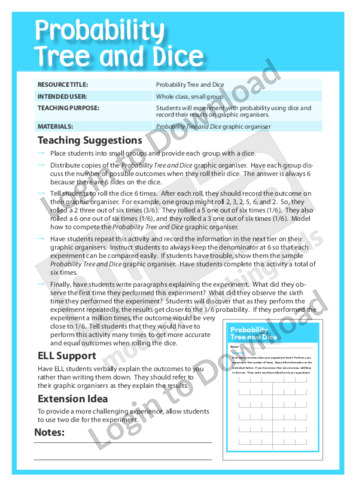
This graphic organiser, ‘Probability Tree and Dice’ asks students to experiment with probability using dice and record their findings.
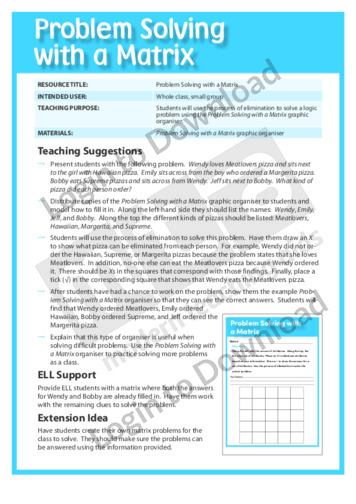
This graphic organiser, ‘Problem Solving with a Matrix’ asks students to use the process of elimination to solve a logic problem.
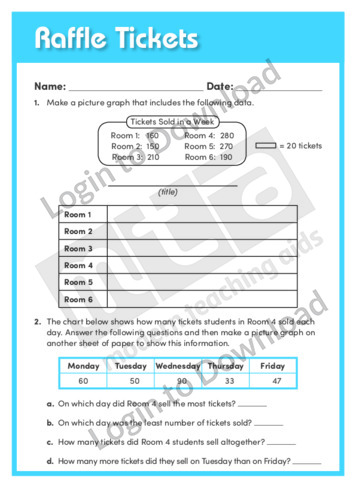
This data representation worksheet, ‘Raffle Tickets’ asks students to practise interpreting picture graphs.
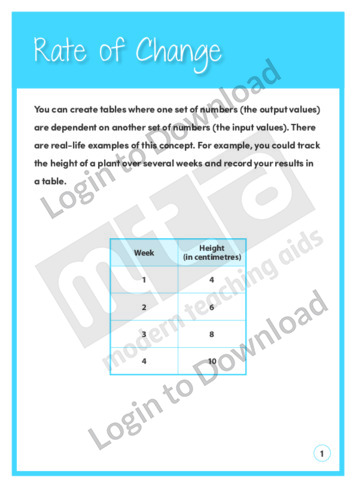
This patterns and algebra worksheet, ‘Rate of Change’ offers guidance on recognising change in quantities. Answer sheet provided with file download.
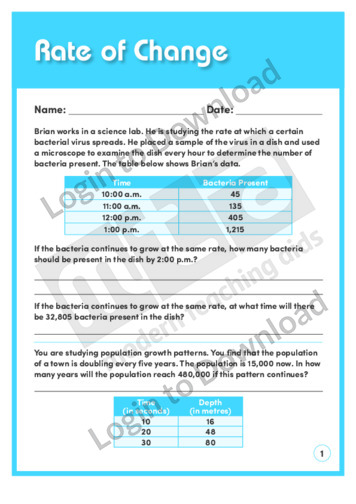
This patterns and algebra worksheet, ‘Rate of Change’ allows for practice with tables and graphs depicting rate of change. Answer sheet provided with file download.
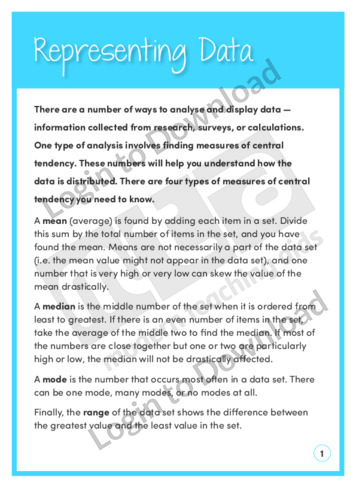
This data and probability worksheet, ‘Representing Data’ allows for practice representing and classifying data and using measures of central tendency. Answer sheet provided with file download.
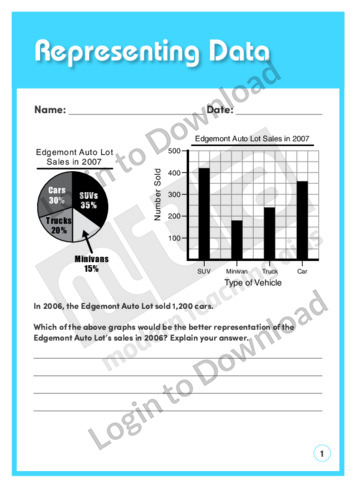
This data and probability worksheet, ‘Representing Data’ allows for practice with graphs and tables. Answer sheet provided with file download.
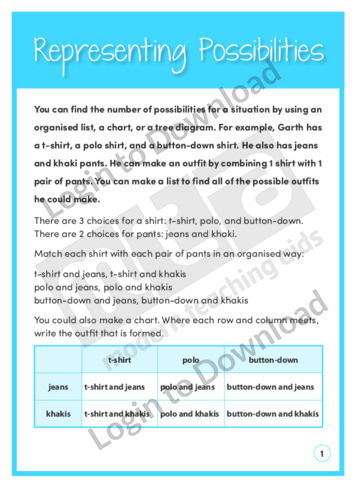
This data and probability worksheet, ‘Representing Possibilities’ allows for practice representing all possibilities for a simple counting situation. Answer sheet provided with file download.
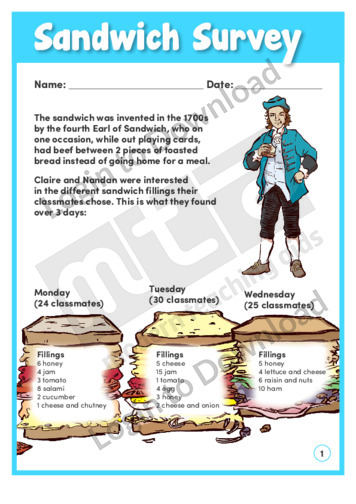
The children in this practical learning activity love to eat sandwiches for lunch. The ‘Sandwich Survey’ shows some of the results of a survey they did, leaving students to find equivalent fractions. They can also carry out a similar survey of the lunch choices of their classmates. This activity includes comprehensive teaching notes to be …More
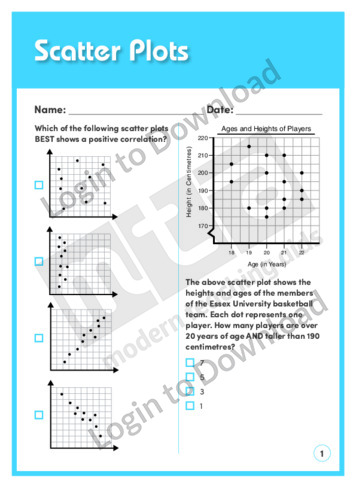
This data and probability worksheet, ‘Scatter Plots’ allows for practice with scatter plots. Answer sheet provided with file download.
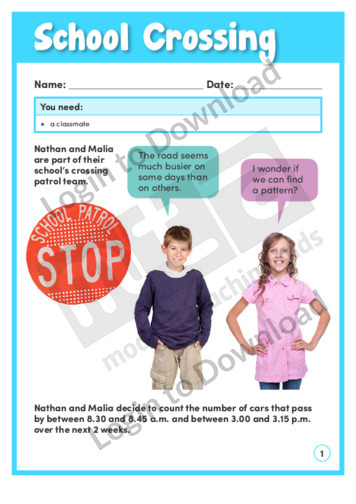
In ‘School Crossing’, Nathan and Malia are trying to find a pattern in the traffic outside their school. The learning activity asks students to interpret a time-series graph and assess the validity of statements made about it. Students then conduct their own statistical investigation. An answer sheet is provided and includes teaching notes with suggestions …More
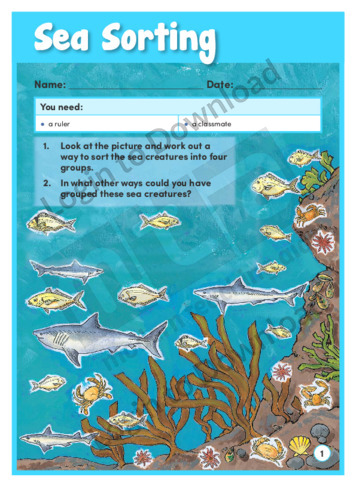
The learning activity, ‘Sea Sorting’ asks students to sort a variety of sea creatures into groups. Students make decisions about the ways they will sort and represent their data. They then write questions about their data for their classmates to solve. The activity requires an understanding of the different kinds of graphs and which ones …More
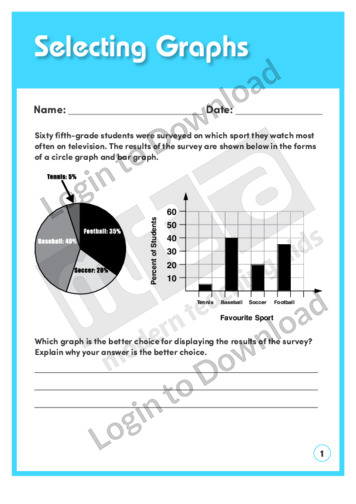
This data and probability worksheet, ‘Selecting Graphs’ allows for practice choosing the appropriate graph to use in a given situation. Answer sheet provided with file download.
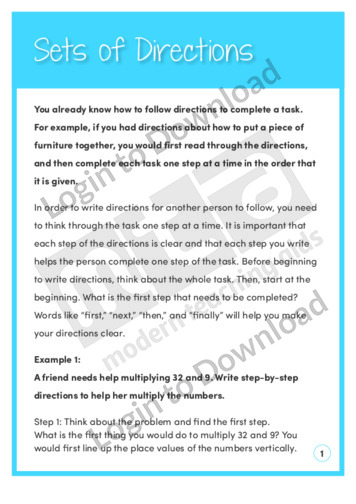
This data and probability worksheet, ‘Sets of Directions’ allows for practice following, devising and describing practical sets of directions. Answer sheet provided with file download.
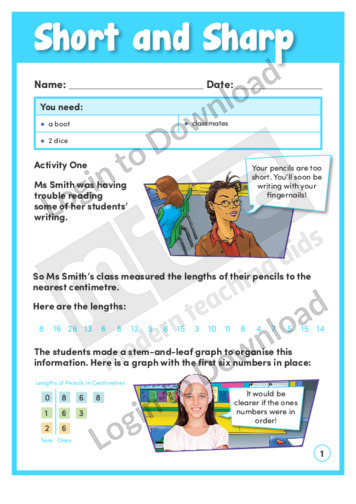
This learning activity, ‘Short and Sharp’, introduces stem-and-leaf graphs and shows how they can be used to organise numbers, such as pencil measurements, house numbers, or dice throws. An answer sheet is provided and includes teaching notes with suggestions for supporting learning and further exploration.
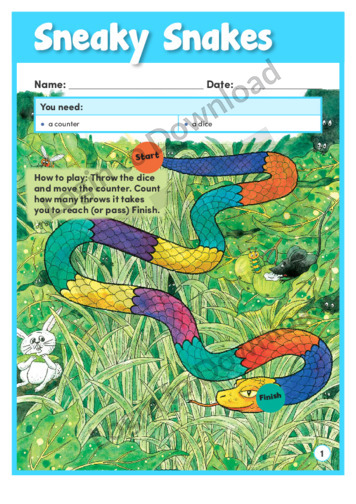
This learning activity, ‘Sneaky Snakes’, includes a board and instructions for a simple game of chance. Students play the game and record how many throws it takes to reach the finish. They then analyse the data. The accompanying teaching notes include suggestions for supporting learning and further exploration.
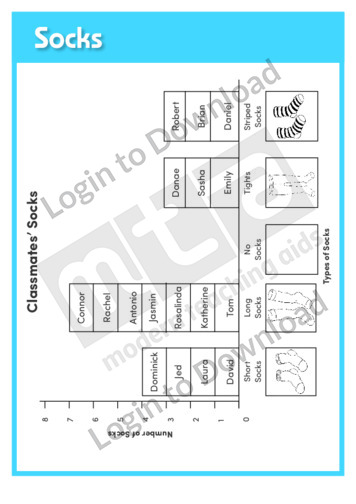
This data representation exemplar, ‘Socks’ offers an introduction to bar graphs.
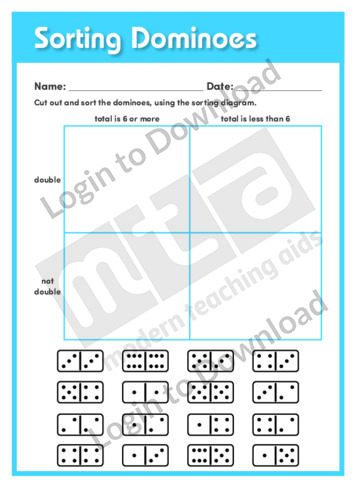
This data representation worksheet, ‘Sorting Dominoes’ asks students to practise sorting dominoes using a sorting diagram.
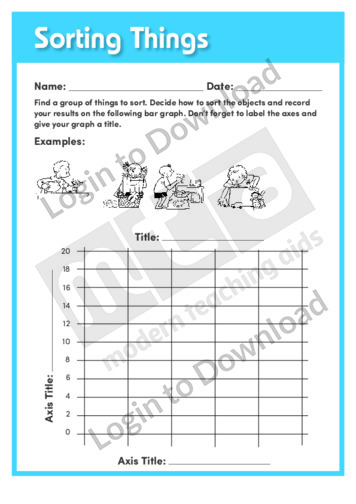
This data representation worksheet, ‘Sorting Things’ asks students to practise creating bar graphs.
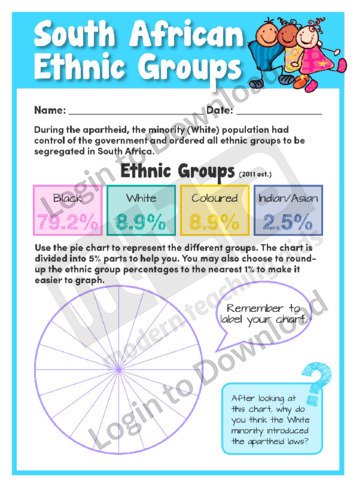
This worksheet, ‘South African Ethnic Groups’ is a great resource that examines the ratio of different ethnic groups within South Africa. Students are provided with the statistics of percentages of each ethnic group (2011 est.) and are asked to put these numbers into the pie chart provided. The chart is divided into 5% parts to …More
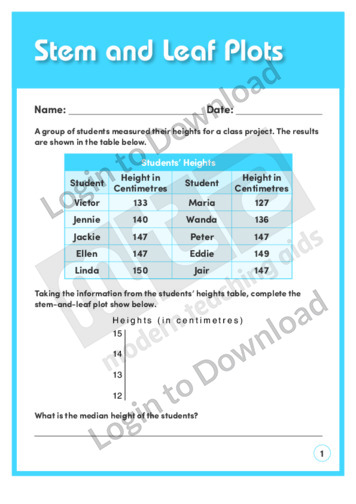
This data and probability worksheet, ‘Stem and Leaf Plots’ allows for practice interpreting and creating stem and leaf plots. Answer sheet provided with file download.
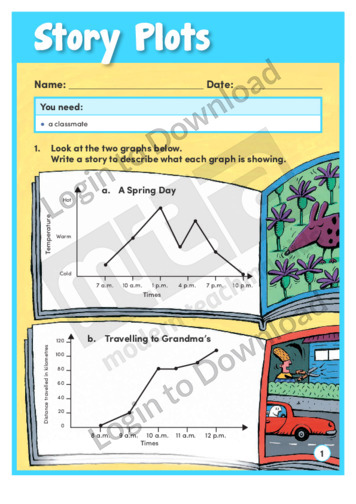
This learning activity, ‘Story Plots’, prompts students to write stories based on graphs that show the temperature on a spring day and the distance travelled on a car journey. An answer sheet is provided and includes teaching notes with suggestions for supporting learning and further exploration.
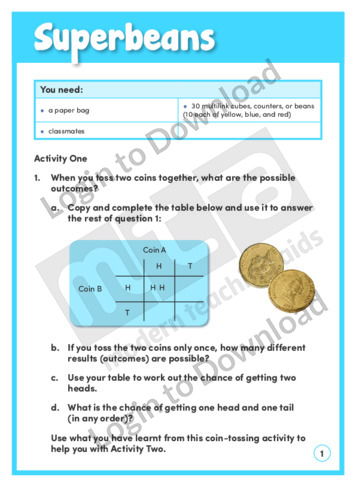
This learning activity ‘Superbeans’ provides two examples of ways to investigate probability, using first two-differences (coin toss) then three-differences (coloured beans). An answer sheet is provided and includes accompanying teaching notes with suggestions for supporting learning and further exploration.
This data and probability worksheet, ‘Surveys’ offers guidance on generating data by using surveys. Answer sheet provided with file download.
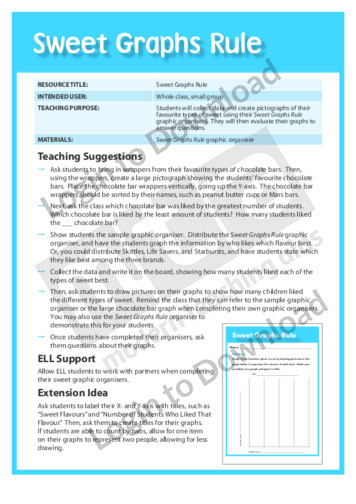
This graphic organiser, ‘Sweet Graphs Rule’ helps students to collect data a create pictographs of their favourite sweet.
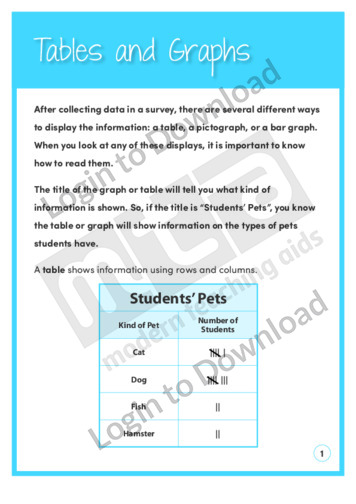
This data and probability worksheet, ‘Tables and Graphs’ allows for practice using tables and graphs. Answer sheet provided with file download.
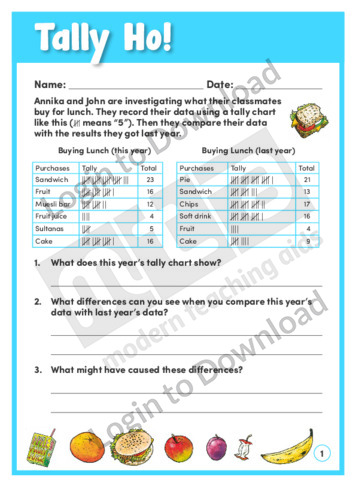
In ‘Tally Ho!’, Annika and John use tally charts to record what their classmates buy for lunch. When they compare it to last year’s data, there are some significant differences. The learning activity asks students to analyse the data and deduce the reasons for the changes. An answer sheet is provided and includes teaching notes …More
This worksheet, ‘Tallying Olympics Host Countries’ is a fantastic resource to link mathematics with the Olympics. Students are provided with a chart to record the past host countries and on how many occasions they have held the Games. Students are then asked to interpret the results of their research. This activity can be completed as …More
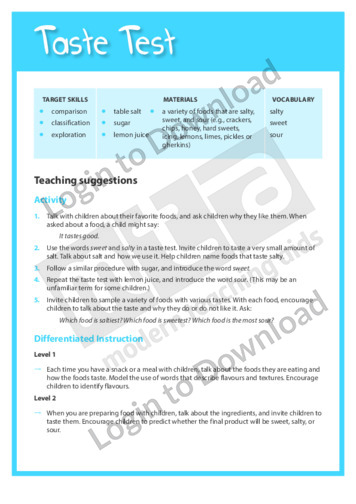
This Beginning Maths activity, ‘Taste Test’ encourages students to explore, compare and classify the different flavours and textures of a variety of foods.
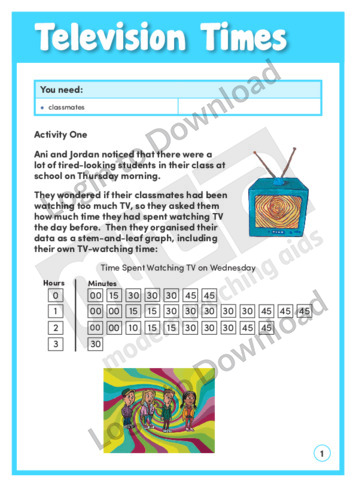
Does too much TV make students tired? In this learning activity, ‘Television Times’ two students gather and use data to answer this question. This learning activity asks students to use the data to generate more questions. In a second activity, students can gather and analyse data from their class. An answer sheet is provided and …More
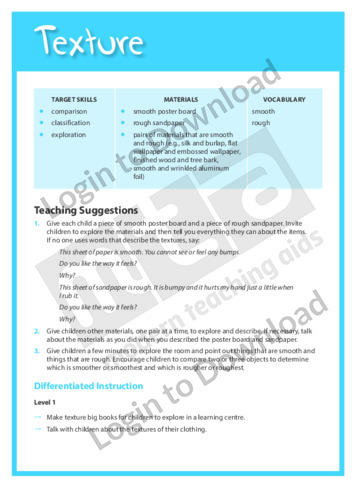
This Beginning Maths activity, ‘Texture’ encourages students to explore, compare and describe textures of materials.
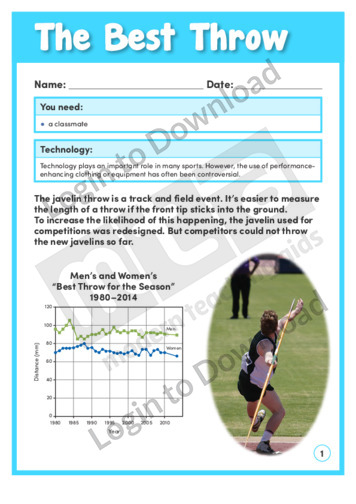
In the learning activity, ‘The Best Throw’ students learn about and discuss the use of technology in sports. They use graphs and tables to evaluate the impact of change on the javelin event, and form opinions about the impact of technology on other sports. This activity includes comprehensive teaching notes to be read before beginning …More
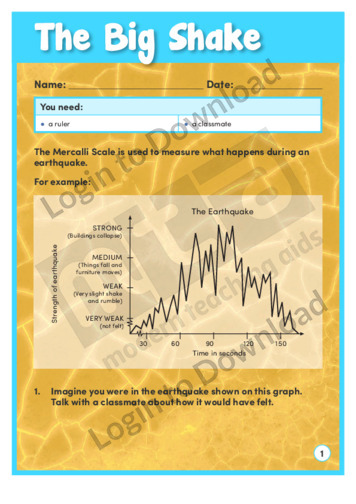
This learning activity, ‘The Big Shake’, uses the Mercalli scale to graph the strength of an earthquake over time. Students complete graphs based on eyewitness descriptions of earthquakes. An answer sheet is provided and includes teaching notes with suggestions for supporting learning and further exploration.
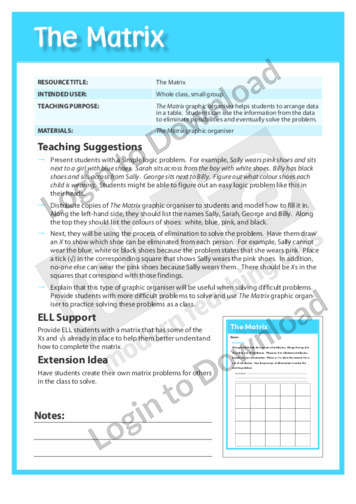
This graphic organiser, ‘The Matrix’ helps students to arrange data in a table, and then use that data to enable them to eliminate possibilities and solve a problem.
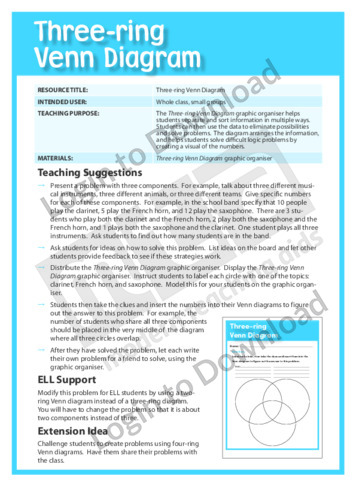
This graphic organiser, ‘Three-Ring Venn Diagram’ helps students to separate and sort information, then use this information to solve problems.
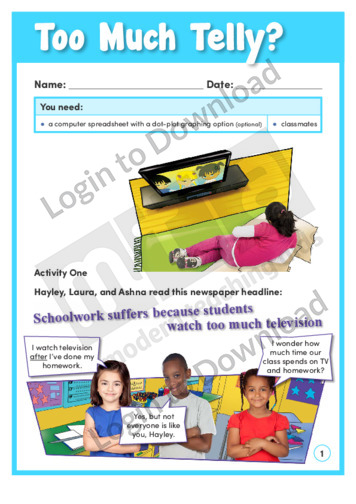
Do students watch too much TV? This learning activity, ‘Too Much Telly’, presents data about time spent on TV and homework as double horizontal dot plots. Students then collect their own data and display it in dot plots. An answer sheet is provided and includes teaching notes with suggestions for supporting learning and further exploration.
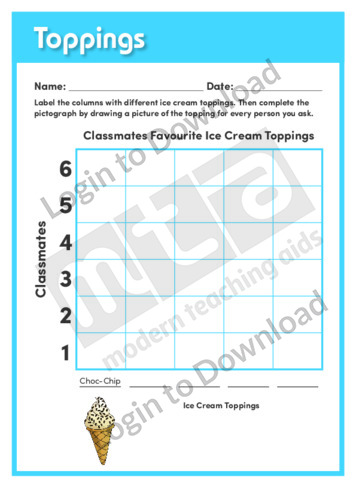
This data representation worksheet, ‘Toppings’ asks students to practise creating pictographs.
This worksheet, ‘Tracking Group A Scores’ is a fantastically engaging activity that provides a table in which students can track the progress of group A teams through the group phase of the FIFA World Cup. Information to be entered includes: how many matches have been played out of the three matches in the group phase, …More
This worksheet, ‘Tracking Group B Scores’ is a fantastically engaging activity that provides a table in which students can track the progress of group B teams through the group phase of the FIFA World Cup. Information to be entered includes: how many matches have been played out of the three matches in the group phase, …More
This worksheet, ‘Tracking Group C Scores’ is a fantastically engaging activity that provides a table in which students can track the progress of group C teams through the group phase of the FIFA World Cup. Information to be entered includes: how many matches have been played out of the three matches in the group phase, …More
This worksheet, ‘Tracking Group D Scores’ is a fantastically engaging activity that provides a table in which students can track the progress of group D teams through the group phase of the FIFA World Cup. Information to be entered includes: how many matches have been played out of the three matches in the group phase, …More
This worksheet, ‘Tracking Group E Scores’ is a fantastically engaging activity that provides a table in which students can track the progress of group E teams through the group phase of the FIFA World Cup. Information to be entered includes: how many matches have been played out of the three matches in the group phase, …More
This worksheet, ‘Tracking Group F Scores’ is a fantastically engaging activity that provides a table in which students can track the progress of group F teams through the group phase of the FIFA World Cup. Information to be entered includes: how many matches have been played out of the three matches in the group phase, …More
This worksheet, ‘Tracking Group G Scores’ is a fantastically engaging activity that provides a table in which students can track the progress of group G teams through the group phase of the FIFA World Cup. Information to be entered includes: how many matches have been played out of the three matches in the group phase, …More
This worksheet, ‘Tracking Group H Scores’ is a fantastically engaging activity that provides a table in which students can track the progress of group H teams through the group phase of the FIFA World Cup. Information to be entered includes: how many matches have been played out of the three matches in the group phase, …More
This template, ‘Tracking the Results’ is a fantastic resource that can be used as a whole class or individually to track the progress of the winners of swimming events in the Olympics. Students are provided with a table in which they are required to enter the winners of the men’s and women’s 200m races. Students …More
This template, ‘Tracking the World Cup Teams’ is a fantastic resource that can be used as a whole class or individually to track the progress of the FIFA World Cup finalists through the Round of 16 to the final. Students are provided with a table in which they are required to enter the winners and …More
This worksheet, ‘Tracking Your Olympic Team’ is a fantastic resource to develop an understanding about the growth of the Winter Olympic team of a particular country. Students are asked to use tallies or other methods of recording data to measure the size of the Winter Olympic team in each year of the Games since 1924. …More
This worksheet, ‘Tracking Your Olympic Team’ is a fantastic resource to develop an understanding about the growth of the Olympic team of a particular country. Students are asked to use tallies or other methods of recording data to measure the size of the Olympic team in each year of the Games since 1924. Using this …More
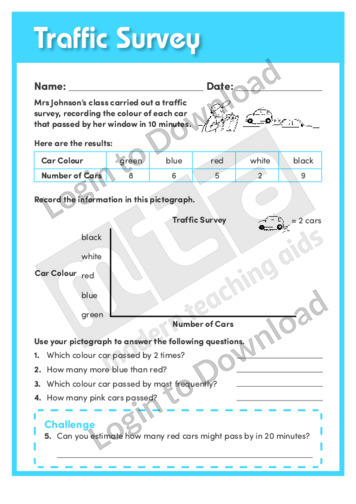
This data representation worksheet, ‘Traffic Survey’ asks students to practise with pictographs.
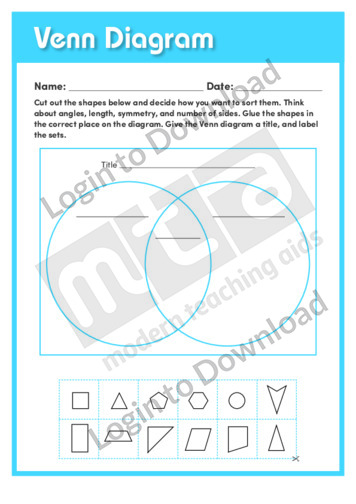
This data representation learning activity, ‘Venn Diagrams’ asks students to practise creating a Venn diagram.
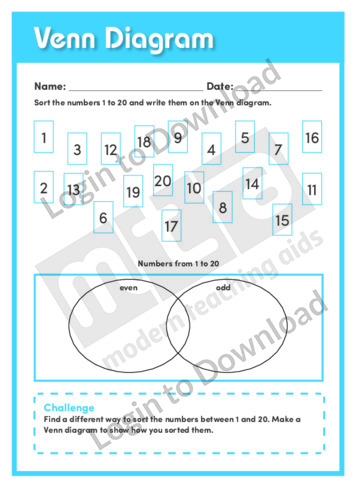
This understanding numbers worksheet, ‘Venn Diagram’ asks students to practise creating Venn Diagrams using odd and even numbers.
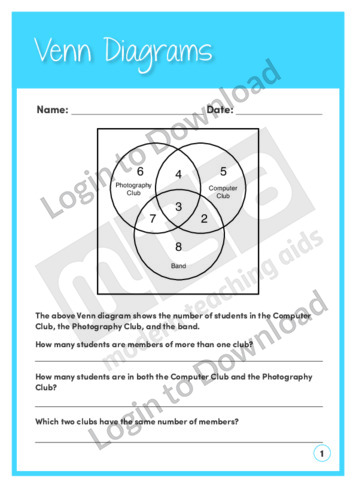
This data and probability worksheet, ‘Venn Diagrams’ allows for practice displaying data. Answer sheet provided with file download.
It�s that easy!