
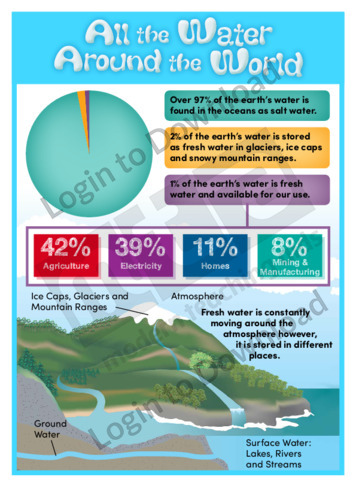
This simple infographic, ‘All the Water Around the World’ is a fantastic colourful resource that is a great addition to a unit on water collection, sanitation or the water cycle. Students are given interesting facts and figures that outline the amount of drinkable water around the world, how it is used and where it is …More
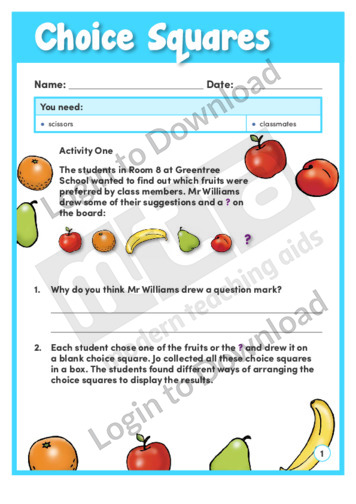
In this learning activity, ‘Choice Squares’, students use the supplied choice squares to collect data from their classmates and create graphs. By analysing the graphs, students can draw conclusions about their classmates’ preferred fruits and winter sports. An answer sheet is provided and includes teaching notes with suggestions for supporting learning and further exploration.
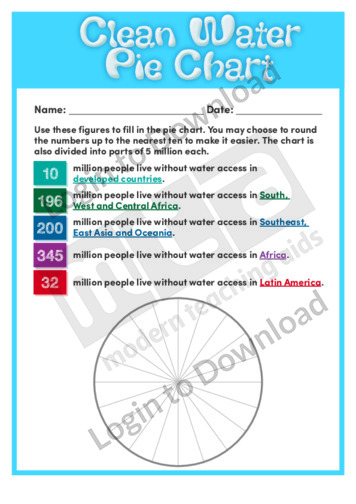
This worksheet, ‘Clean Water Pie Chart’ is a simple resource that links mathematics with a unit of water accessibility around the world. Students are provided with figures and information which they must use to complete the pie chart.
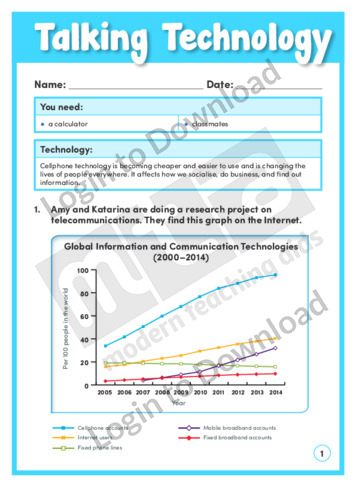
Talking Technology’ is a learning activity that will engage students in finding out just how quickly the world of ICT is changing. Students interpret graphs to make statements and predictions about the use of telecommunications. This activity includes comprehensive teaching notes to be read before beginning the activity with students, as they feature useful background …More
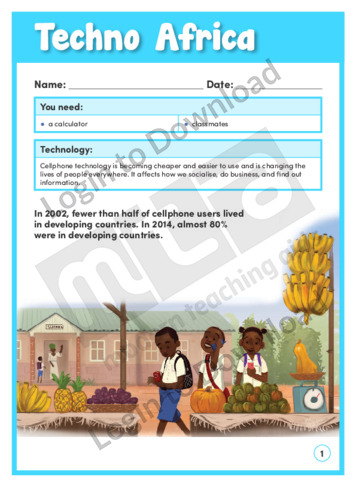
Techno Africa’ is a learning activity that engages students in understanding why cellphone usage has risen dramatically in Africa, and how this usage is helping people. This activity includes comprehensive teaching notes to be read before beginning the activity with students, as they feature useful background information and suggestions for supporting learning. An answer sheet …More
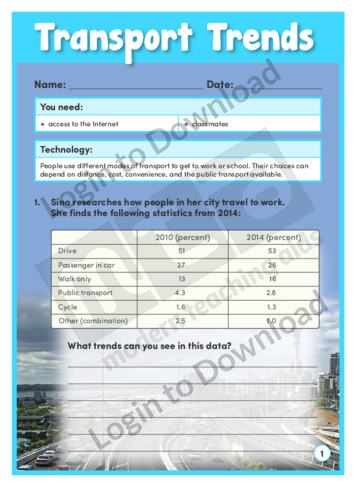
The maths activity, ‘Transport Trends’ gives students data to interpret how people use transport. They can then conduct a survey to collect data and make comparisons themselves. This activity includes comprehensive teaching notes to be read before beginning the activity with students, as they feature useful background information and suggestions for supporting learning. An answer …More
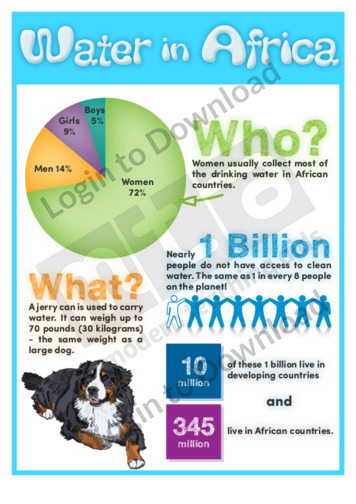
This simple infographic, ‘Water in Africa’ is a fantastic colourful resource that is a great addition to a unit on water collection or sanitation in developing countries. Students are given interesting facts and figures that outline who typically collects the drinking water, how they collect water and how many people do not have access to …More
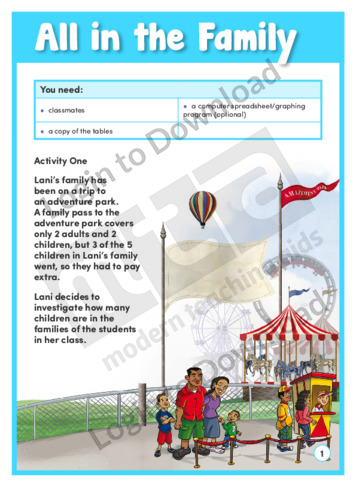
How many children do most families have? This learning activity, ‘All in the Family’ shows how a girl gathers data and represents it in different ways to compare the families in her class. Students can display and interpret her data and then gather data from their own classmates. An answer sheet is provided and includes …More
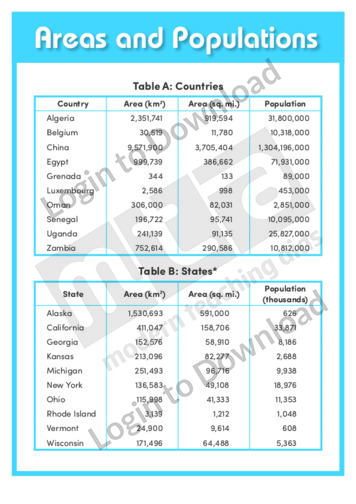
This quick reference chart, ‘Areas and Populations’ offers guidance on the topic of data interpretation.
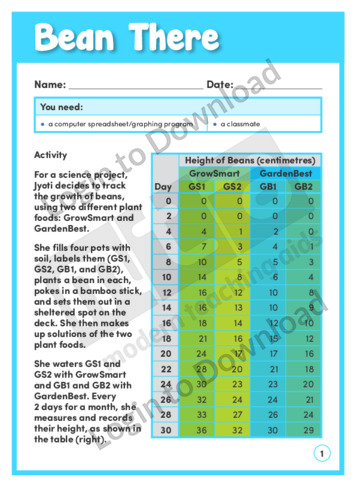
This learning activity, ‘Bean There’, features the results of a science project tracking the growth of beans using two different plant foods. Students use a computer graphing program to create a time-series graph from the data and then design and conduct their own plant food experiment. An answer sheet is provided and includes teaching notes …More
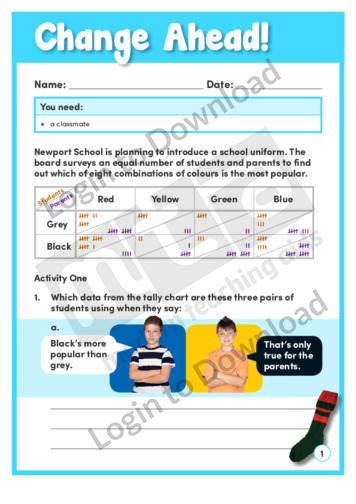
This learning activity, ‘Change Ahead!’, presents the results of a survey about school uniform colours in a tally chart and a stacked bar graph. Students interpret the data and then design a follow-up questionnaire. An answer sheet is provided and includes teaching notes with suggestions for supporting learning and further exploration.
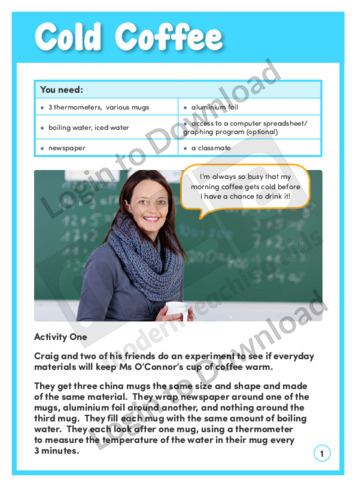
In the hands-on activity, ‘Cold Coffee’ a teacher’s complaint about her coffee sets students off on an experiment that uses data comparisons to determine the best way to keep coffee hot. By replicating the experiment, students are able to gather their own data and make predictions about the results. An answer sheet is provided and …More
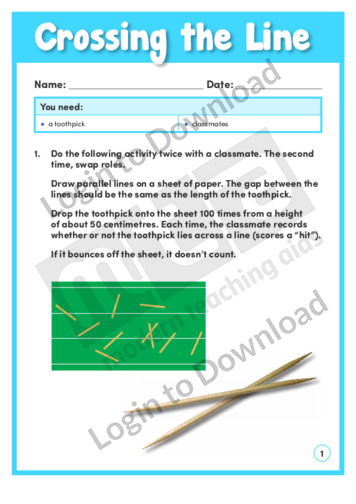
In this learning activity, ‘Crossing the Line’, students conduct an experiment known as Buffon’s Needle by dropping a toothpick onto a lined sheet of paper 100 times. Students analyse their results and express the probability of a hit as a simple fraction. An answer sheet is provided and includes teaching notes with suggestions for supporting …More
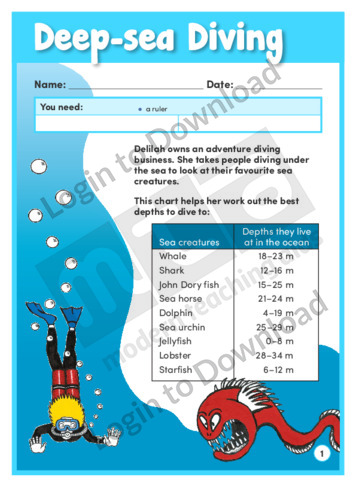
How far down would you have to dive to find a sea horse? In the learning activity, ‘Deep Sea Diving’ students help a diving operator determine how far her clients need to dive to see their favourite fish. Students use graphs to provide visual solutions, showing the relationships between sea creatures and where they live. …More
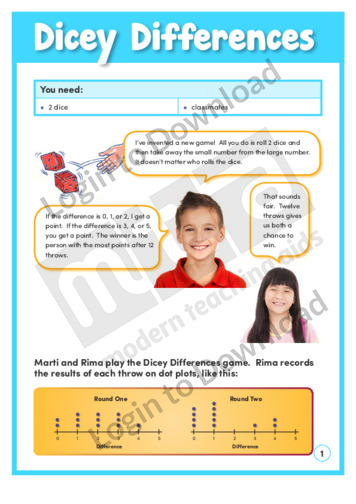
Are dice games fair? In this learning activity, ‘Dicey Differences’ students use repeated throws to gather and display data. They then interpret the data to evaluate the fairness of the dice game. An answer sheet is provided and includes accompanying teaching notes with suggestions for supporting learning and further exploration.
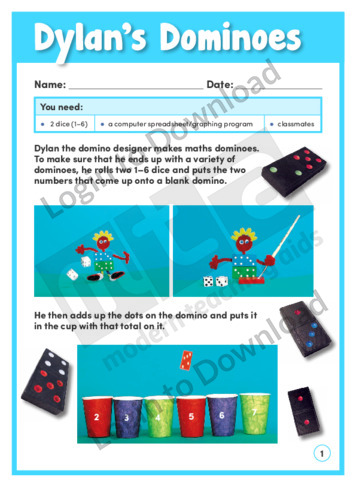
In ‘Dylan’s Dominoes’, a domino designer rolls a pair of dice to decide which dots to put on his dominoes. The learning activity asks students to simulate 40 dice rolls, pool their data, and graph and analyse the results. An answer sheet is provided and includes teaching notes with suggestions for supporting learning and further …More
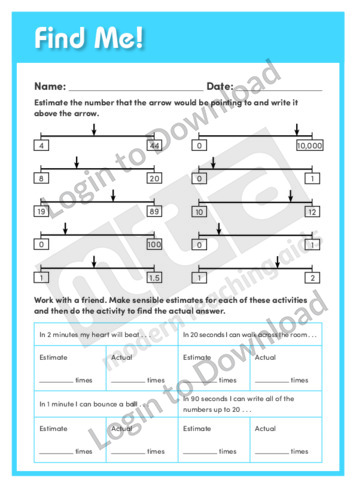
This data interpretation worksheet, ‘Find Me!’ asks students to practise with estimates and exact answers.
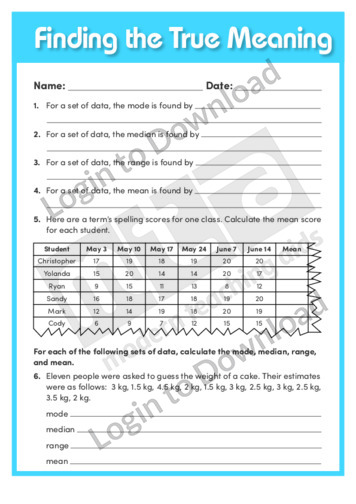
This data interpretation worksheet, ‘Finding the True Meaning’ asks students to practise finding the mode, median, range and mean of given sets of data.
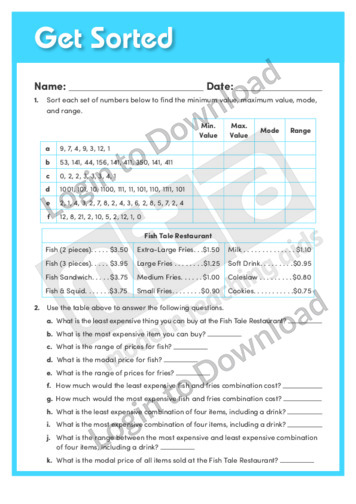
This data interpretation worksheet, ‘Get Sorted 1’ asks students to practise finding the minimum value, maximum value, mode and range of sets of data.
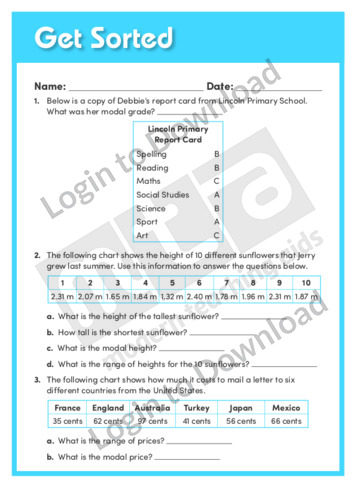
This data interpretation worksheet, ‘Get Sorted 2’ asks students to practise finding the minimum value, maximum value, mode and range of sets of data.
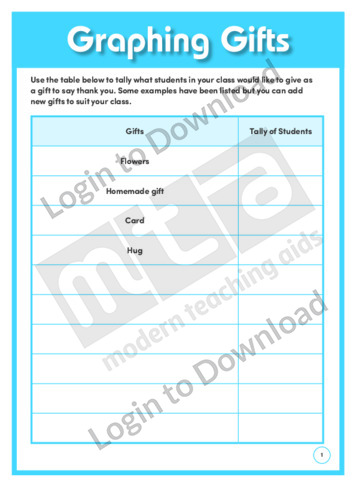
This worksheet, ‘Graphing Gifts’ is a fantastic resource to link mathematics to giving gifts. Students are asked to use tallies or numerals to record gifts that students in the class would choose to give to a special person. Using this table students are then provided with a graph to record their findings. The students are …More
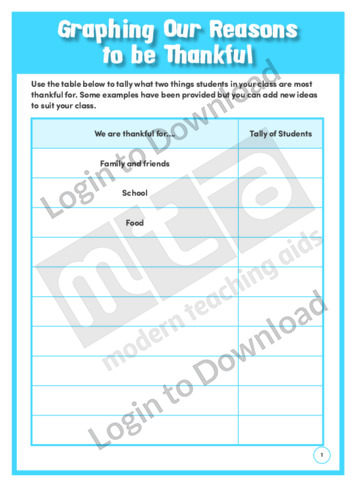
This exercise, ‘Graphing Our Reasons to be Thankful’ involves the whole class in an activity designed to prompt thoughts about gratitude. Students are asked to collect the responses to ‘What are two things you are most thankful for this year’ and then group them into common themes (for example family and friends, good health and …More
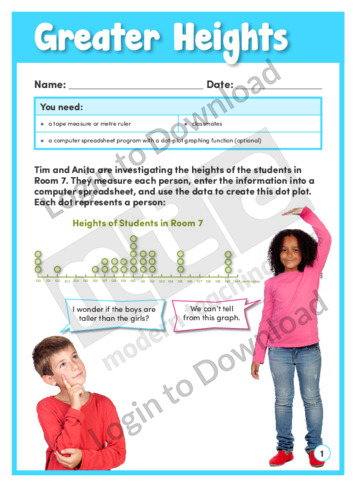
This learning activity, ‘Greater Heights’, shows various dot plots of the heights of boys and girls in the same class and demonstrates that important details can be lost if data is summarised too much. Students analyse the height data of their own class. An answer sheet is provided and includes teaching notes with suggestions for …More
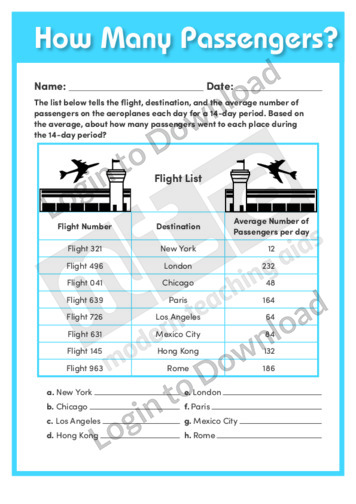
This multiplication and data interpretation worksheet, ‘How Many Passengers?’ asks students to practise solving problem questions using multiplication.
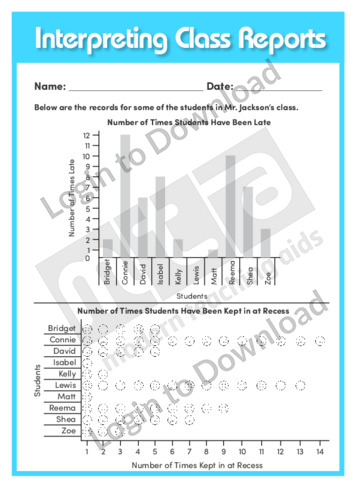
This data interpretation worksheet, ‘Interpreting Class Reports’ asks students to practise interpreting graphs.
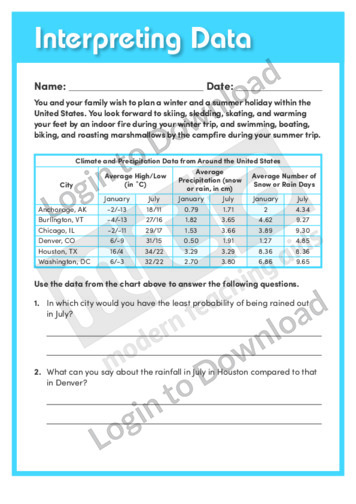
This data interpretation worksheet, ‘Interpreting Data’ asks students to practise interpreting probability charts.
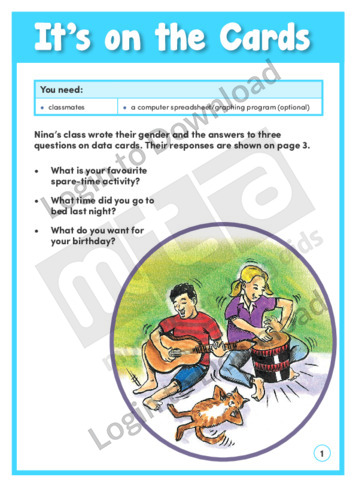
In this learning activity, ‘It’s On the Cards’, Nina’s class wrote some personal information on data cards. The information was displayed as a dot plot then used to help answer some questions. Students can use the activity to gather, represent, and interpret data within their own class. An answer sheet is provided and includes accompanying …More
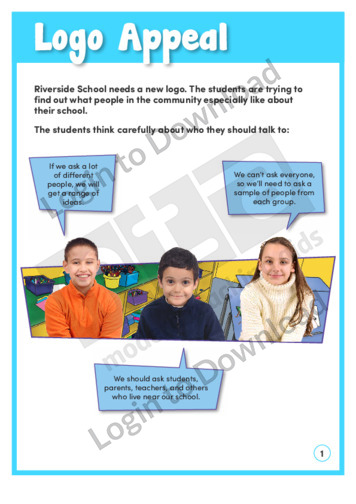
In ‘Logo Appeal’, a community survey helps the designers of Riverside School’s new logo. This learning activity introduces the statistical enquiry cycle and prompts students to use it to answer their own question. An answer sheet is provided and includes teaching notes with suggestions for supporting learning and further exploration.
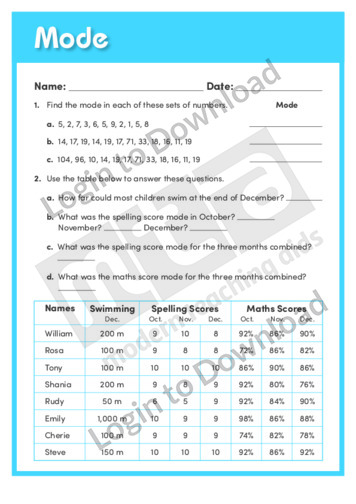
This data interpretation worksheet, ‘Mode’ asks students to practise finding the mode of sets of data.
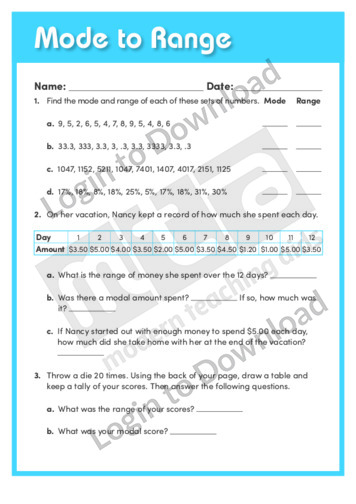
This data interpretation worksheet, ‘Mode to Range’ asks students to practise finding the mode and range of sets of data.
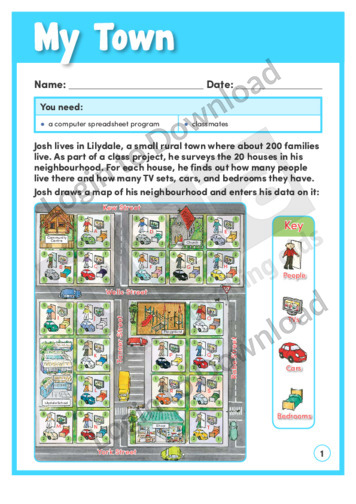
In ‘My Town’, Josh surveys houses in his neighbourhood and draws a map to show his results. The learning activity prompts students to use a computer spreadsheet program to sort and analyse Josh’s data. An answer sheet is provided and includes teaching notes with suggestions for supporting learning and further exploration.
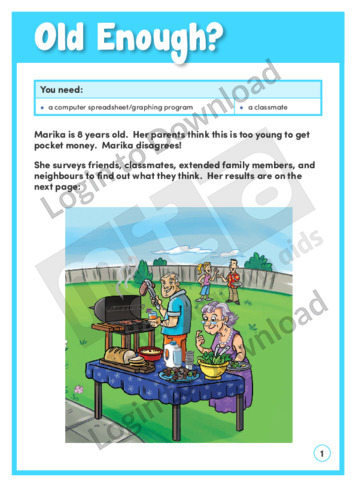
In this learning activity, ‘Old Enough?’ Marika surveys a range of people to find out the age at which children should be allowed to receive pocket money. Students display the results in a spreadsheet and interpret the data to answer questions. An answer sheet is provided and includes accompanying teaching notes with suggestions for supporting …More
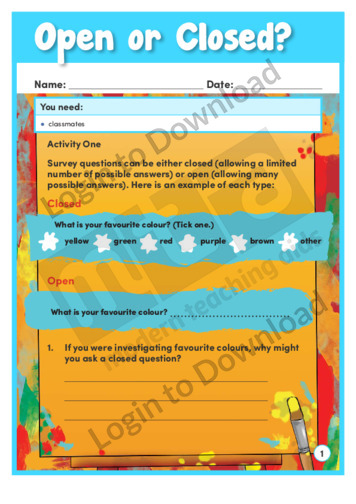
This learning activity, ‘Open or Closed?’, introduces the concept of open and closed questions and prompts students to analyse their use in surveys. Students then write and conduct their own survey. An answer sheet is provided and includes teaching notes with suggestions for supporting learning and further exploration.
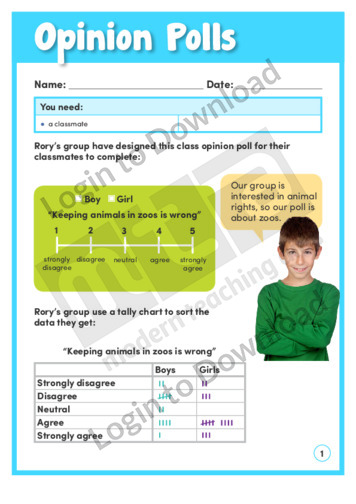
This learning activity, ‘Opinion Polls’, presents the results of an opinion poll about zoos in a variety of graphs. Students assess the data and explore the use of the Likert scale in opinion polls. An answer sheet is provided and includes teaching notes with suggestions for supporting learning and further exploration.
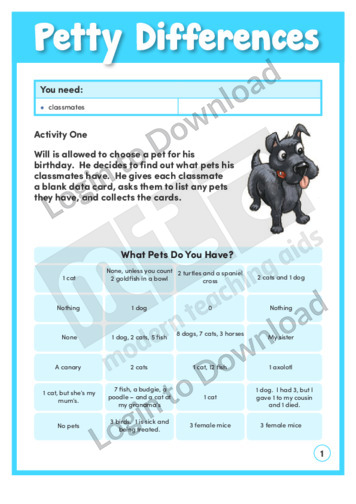
In this learning activity, ‘Petty Differences’ Will is allowed to choose a pet, so he surveys his classmates to help make his decision. Students can analyse the data he gathers then use different methods to represent and compare data. An answer sheet is provided and includes accompanying teaching notes with suggestions for supporting learning and …More
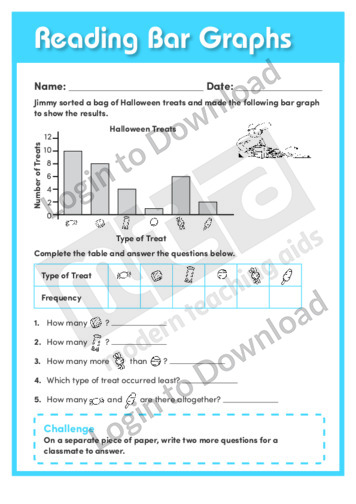
This data interpretation worksheet, ‘Reading Bar Graphs’ asks students to practise analysing bar graphs.
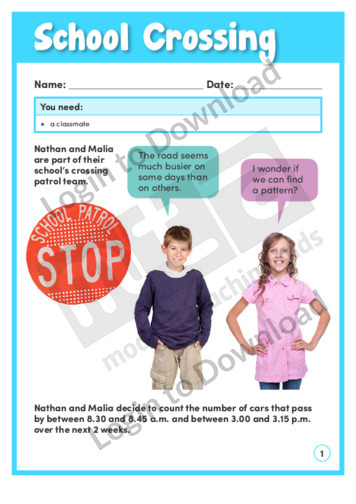
In ‘School Crossing’, Nathan and Malia are trying to find a pattern in the traffic outside their school. The learning activity asks students to interpret a time-series graph and assess the validity of statements made about it. Students then conduct their own statistical investigation. An answer sheet is provided and includes teaching notes with suggestions …More
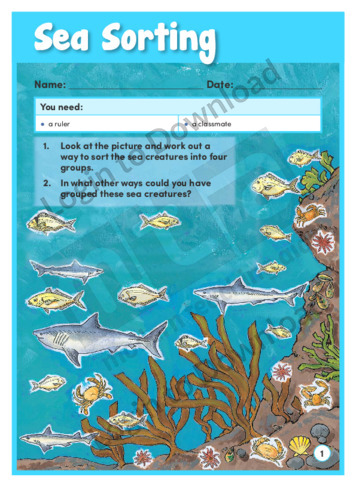
The learning activity, ‘Sea Sorting’ asks students to sort a variety of sea creatures into groups. Students make decisions about the ways they will sort and represent their data. They then write questions about their data for their classmates to solve. The activity requires an understanding of the different kinds of graphs and which ones …More
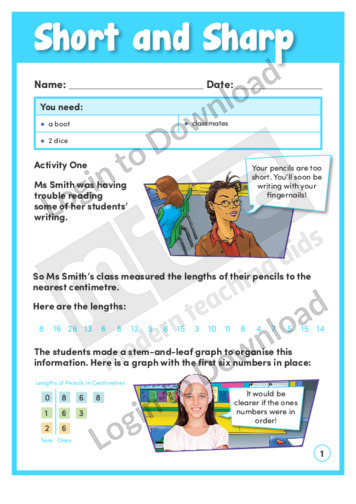
This learning activity, ‘Short and Sharp’, introduces stem-and-leaf graphs and shows how they can be used to organise numbers, such as pencil measurements, house numbers, or dice throws. An answer sheet is provided and includes teaching notes with suggestions for supporting learning and further exploration.
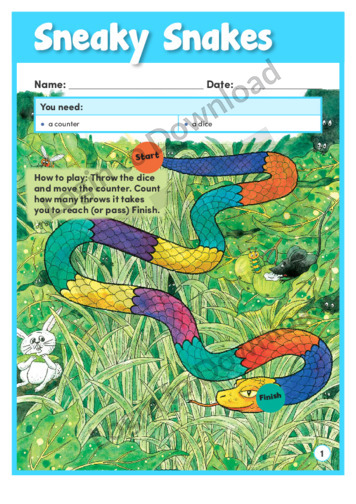
This learning activity, ‘Sneaky Snakes’, includes a board and instructions for a simple game of chance. Students play the game and record how many throws it takes to reach the finish. They then analyse the data. The accompanying teaching notes include suggestions for supporting learning and further exploration.
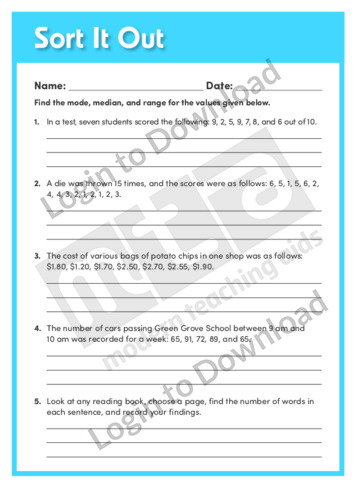
This data interpretation worksheet, ‘Sort It Out’ asks students to practise finding the mode, median and range of given values.
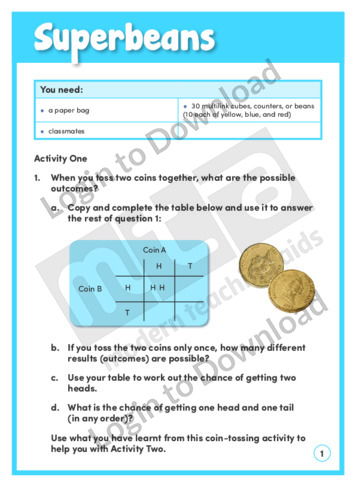
This learning activity ‘Superbeans’ provides two examples of ways to investigate probability, using first two-differences (coin toss) then three-differences (coloured beans). An answer sheet is provided and includes accompanying teaching notes with suggestions for supporting learning and further exploration.
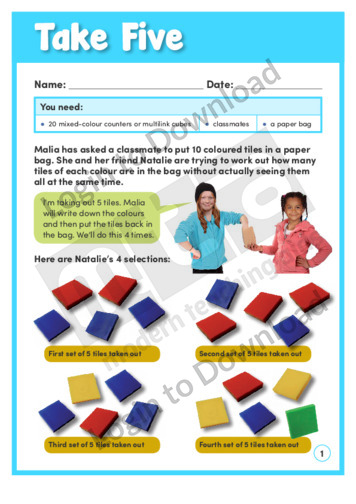
This learning activity, ‘Take Five’, explores probability, sampling, and variation. Students take a series of coloured tiles from a bag and use these samples as the basis for predictions about the unseen contents of the bag. An answer sheet is provided and includes teaching notes with suggestions for supporting learning and further exploration.
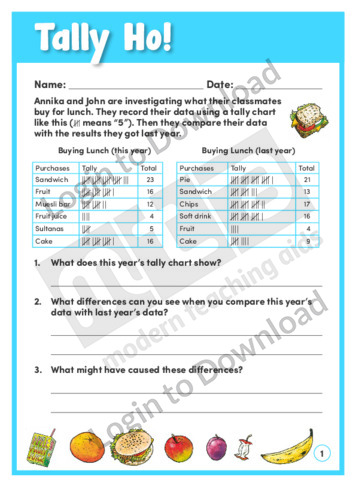
In ‘Tally Ho!’, Annika and John use tally charts to record what their classmates buy for lunch. When they compare it to last year’s data, there are some significant differences. The learning activity asks students to analyse the data and deduce the reasons for the changes. An answer sheet is provided and includes teaching notes …More
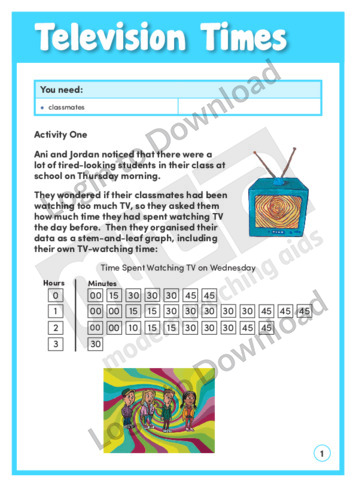
Does too much TV make students tired? In this learning activity, ‘Television Times’ two students gather and use data to answer this question. This learning activity asks students to use the data to generate more questions. In a second activity, students can gather and analyse data from their class. An answer sheet is provided and …More
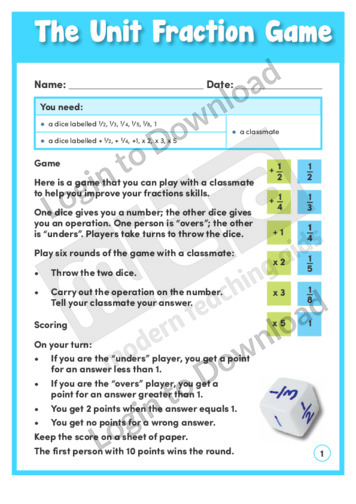
This learning activity, ‘The Unit Fraction Game’, provides instructions on how to play a dice game that improves fractions skills. Students play the game and then devise a way to test whether the game is fair. An answer sheet is provided and includes teaching notes with suggestions for supporting learning and further exploration.
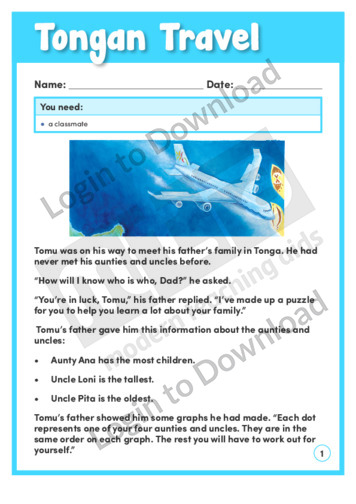
In the learning activity, ‘Tongan Travel’ Tomu’s father gives him clues to help Tomu identify the aunties and uncles he has never met. The learning activity gives students an opportunity to explore the use of graphs that don’t have units of measurement. Instead they need to use clues and graphed relationships to solve problems. An …More
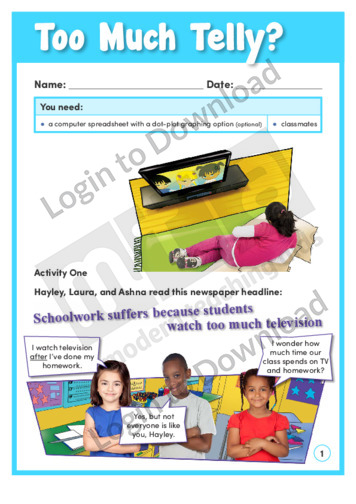
Do students watch too much TV? This learning activity, ‘Too Much Telly’, presents data about time spent on TV and homework as double horizontal dot plots. Students then collect their own data and display it in dot plots. An answer sheet is provided and includes teaching notes with suggestions for supporting learning and further exploration.
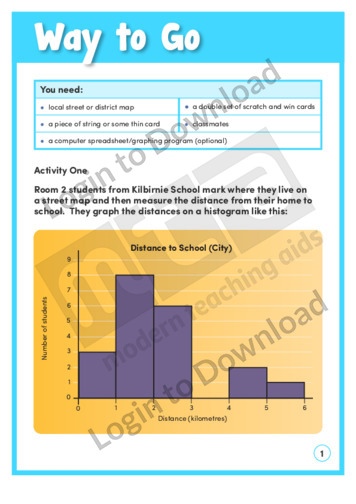
In this learning activity ‘Way To Go’, students in a city school gather data to compare the distances they travel to school with students in a rural school. The activity requires students to represent the data in two different ways. They are then encouraged to survey their classmates and make comparisons with the data they …More
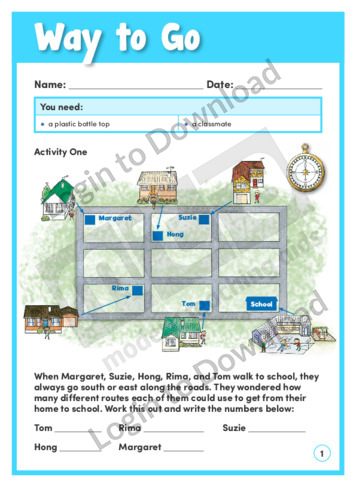
This learning activity, ‘Way to Go’, presents two activities that ask students to record and analyse outcomes. The first activity involves a map of routes to school, and the second activity describes a trial of bottle top throws. An answer sheet is provided and includes teaching notes with suggestions for supporting learning and further exploration.
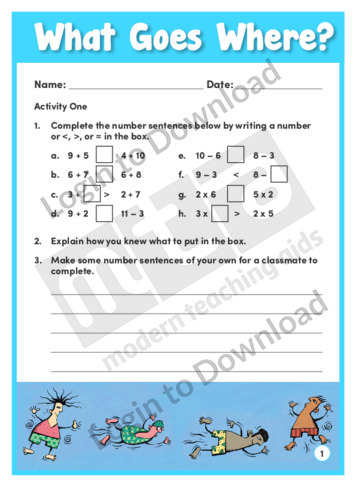
In this learning activity, ‘What Goes Where?’, students find the missing number or sign in a series of number sentences and also use a flow chart to place children into swimming groups. An answer sheet is provided and includes teaching notes with suggestions for supporting learning and further exploration.
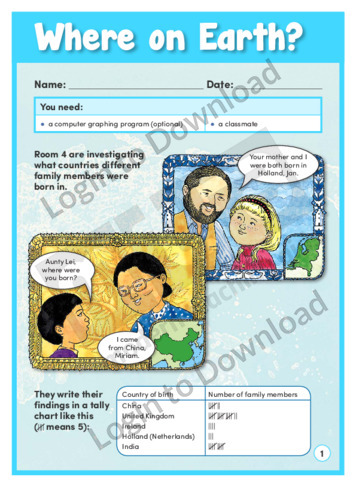
In ‘Where on Earth?’, a class investigates where different family members were born and shows the data in various graphs. The learning activity asks students to analyse the graphs and suggest improvements and then to create their own graphs. An answer sheet is provided and includes teaching notes with suggestions for supporting learning and further …More
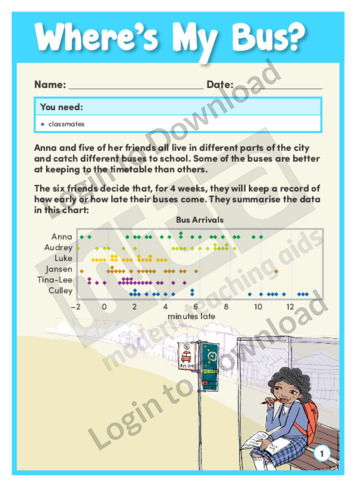
In ‘Where’s My Bus?’, six friends record how early or late their buses come. The learning activity asks students to compare six graphically presented data sets, write generalisations based on the dot plots, and decide which bus is the most reliable. An answer sheet is provided and includes teaching notes with suggestions for supporting learning …More
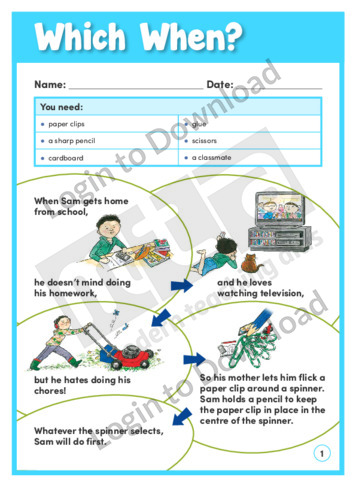
In this learning activity, ‘Which When?’, Sam uses two different spinners to decide what to do after school. Using the supplied template, students make their own spinners and record the results of their spins. An answer sheet is provided and includes teaching notes with suggestions for supporting learning and further exploration.
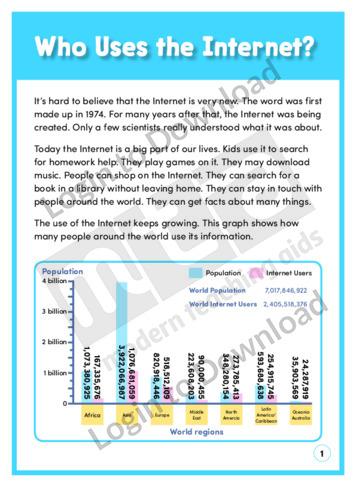
This content area reading activity, ‘Who Uses the Internet?’ is a maths based reading comprehension exercise encouraging students to compare and contrast information using charts.
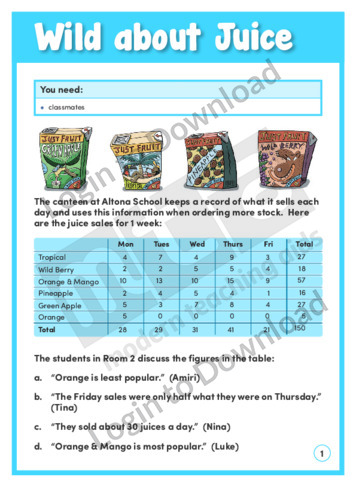
This learning activity ‘Wild About Juice’ uses the supplies of juices in a school canteen to help students understand how data can be interpreted for a practical purpose. Students need to discuss and evaluate statements to determine which juices are most popular and how many boxes of each kind the canteen needs to order. An …More
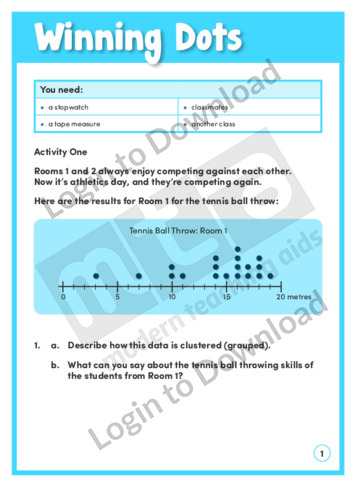
This learning activity, ‘Winning Dots’ shows how sporting data can be represented and interpreted. Students are encouraged to carry out a task then gather, represent, and interpret the data generated. An answer sheet is provided and includes accompanying teaching notes with suggestions for supporting learning and further exploration.
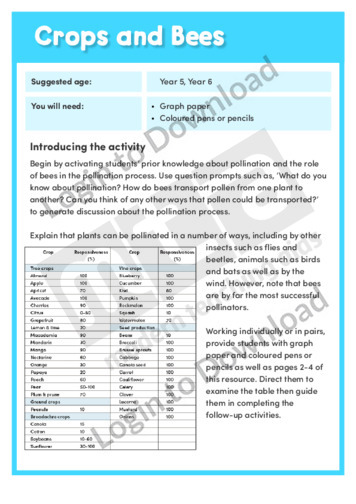
This maths activity uses real-world data to engage students in discussions and observations about the importance of pollination in food production in Australia. The activity begins with some question prompts for teachers to engage students’ existing knowledge about pollination and how bees contribute to pollination. Students are then provided with a table listing crops and …More
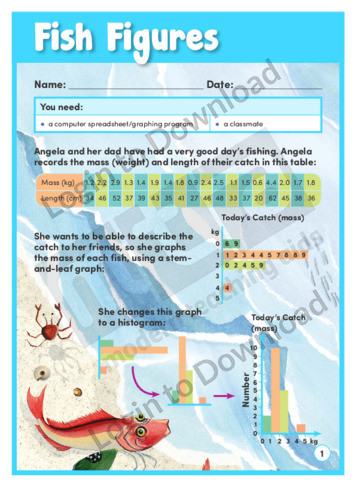
After a good day’s fishing, Angela and her dad record the mass and length of their catch. This learning activity, ‘Fish Figures’, asks students to convert stem-and-leaf graphs into histograms, create a scatter plot, and use trendlines to make predictions. An answer sheet is provided and includes teaching notes with suggestions for supporting learning and …More
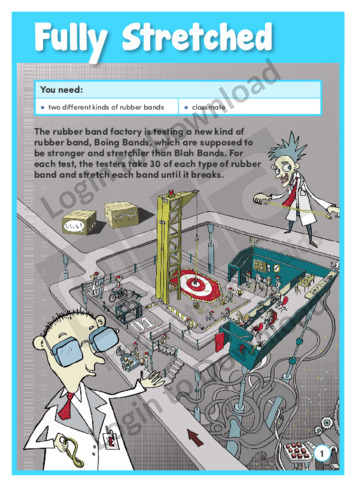
In this learning activity, ‘Fully Stretched’, students analyse the results of an experiment testing the relative strengths of two brands of rubber band. They then carry out their own rubber band comparison and graph the results. An answer sheet is provided and includes teaching notes with suggestions for supporting learning and further exploration.
It�s that easy!