Detailed description
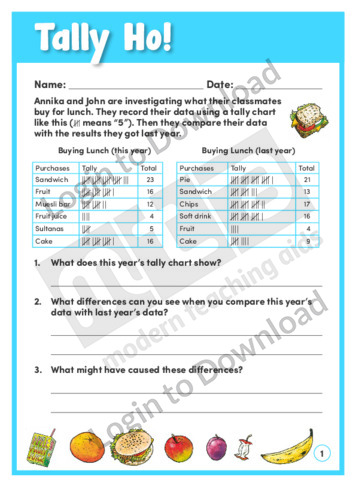
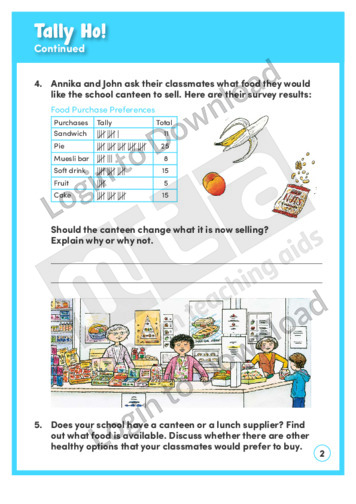
In ‘Tally Ho!’, Annika and John use tally charts to record what their classmates buy for lunch. When they compare it to last year’s data, there are some significant differences. The learning activity asks students to analyse the data and deduce the reasons for the changes. An answer sheet is provided and includes teaching notes with suggestions for supporting learning and further exploration.


