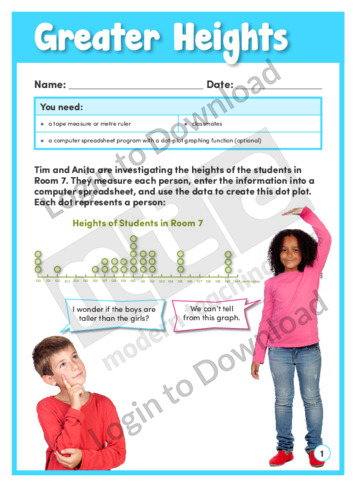
This learning activity, ‘Greater Heights’, shows various dot plots of the heights of boys and girls in the same class and demonstrates that important details can be lost if data is summarised too much. Students analyse the height data of their own class. An answer sheet is provided and includes teaching notes with suggestions for …More
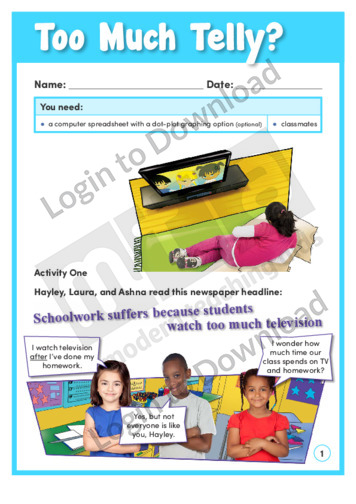
Do students watch too much TV? This learning activity, ‘Too Much Telly’, presents data about time spent on TV and homework as double horizontal dot plots. Students then collect their own data and display it in dot plots. An answer sheet is provided and includes teaching notes with suggestions for supporting learning and further exploration.
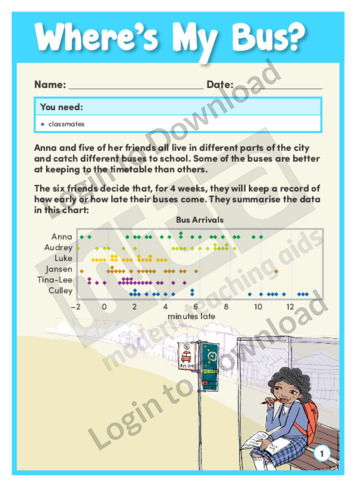
In ‘Where’s My Bus?’, six friends record how early or late their buses come. The learning activity asks students to compare six graphically presented data sets, write generalisations based on the dot plots, and decide which bus is the most reliable. An answer sheet is provided and includes teaching notes with suggestions for supporting learning …More
In this learning activity, ‘Fully Stretched’, students analyse the results of an experiment testing the relative strengths of two brands of rubber band. They then carry out their own rubber band comparison and graph the results. An answer sheet is provided and includes teaching notes with suggestions for supporting learning and further exploration.
It�s that easy!


