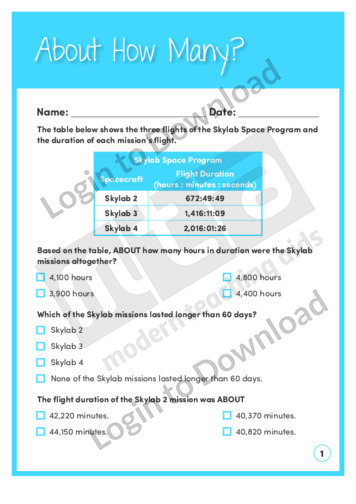
This number and operations worksheet, ‘About How Many?’ allows for practice with estimation. Answer sheet provided with file download.
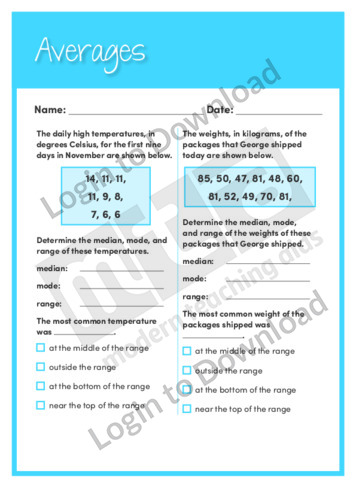
This data and probability worksheet, ‘Averages’ allows for practice using mean, median and mode. Answer sheet provided with file download.
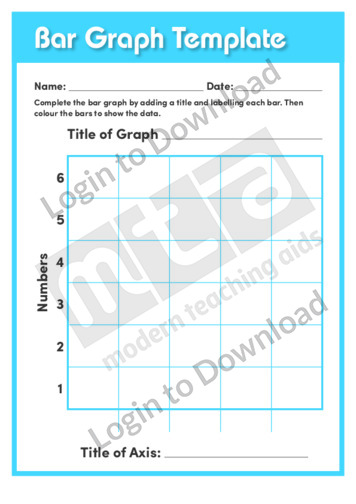
This data representation template, ‘Bar Graph Template’ can be reproduced for classroom use.
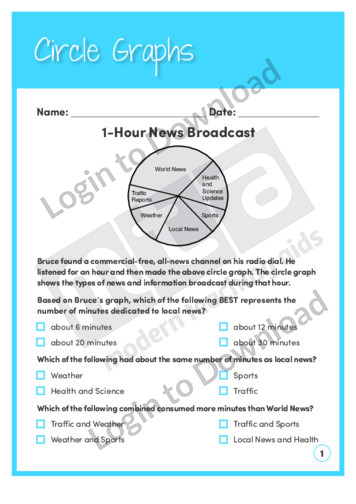
This data and probability worksheet, ‘Circle Graphs’ allows for practice with circle graphs. Answer sheet provided with file download.
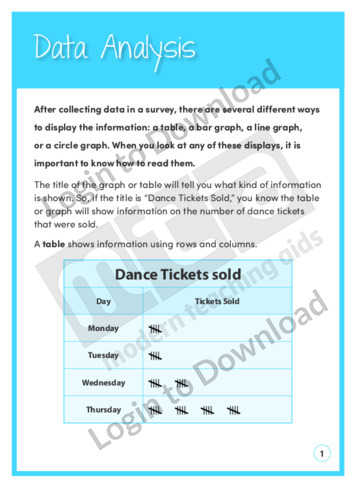
This data and probability worksheet, ‘Data Analysis’ allows for practice interpreting displays of data. Answer sheet provided with file download.
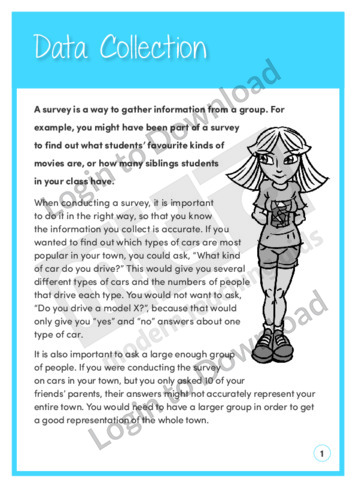
This data and probability worksheet, ‘Data Collection’ allows for practice collecting and displaying data. Answer sheet provided with file download.
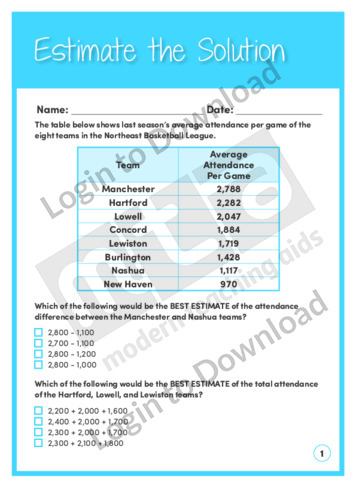
This number and operations worksheet, ‘Estimate the Solution’ allows for practice estimating based on tables. Answer sheet provided with file download.
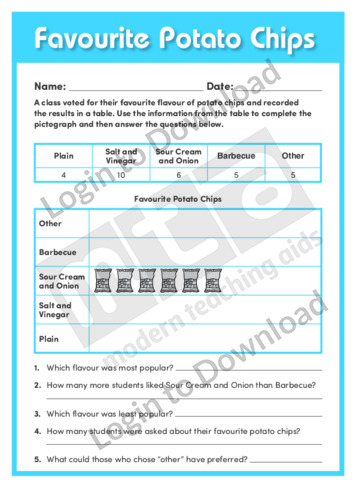
This data representation worksheet, ‘Favourite Potato Chips’ asks students to practise creating and interpreting pictographs.
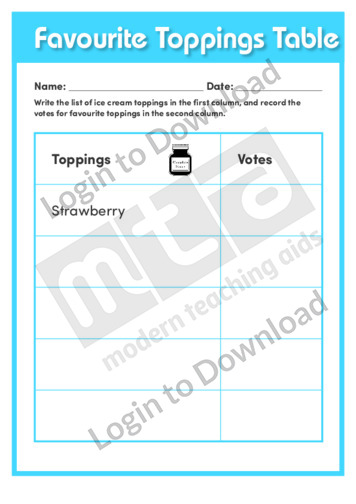
This data representation worksheet, ‘Favourite Toppings Table’ asks students to practise creating pictographs.
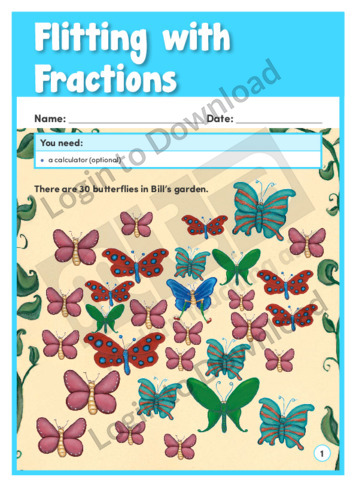
Bill has 30 butterflies in the garden shown in this learning activity, ‘Flitting with Fractions’. Students have to use fractions to solve problems when Bill and his friends catch the butterflies. An answer sheet is provided and includes accompanying teaching notes with suggestions for supporting learning and further exploration.
This graphic organiser, ‘Graphing Information’ supports the teaching of mathematics and writing by giving students a template for creating a simple graph.
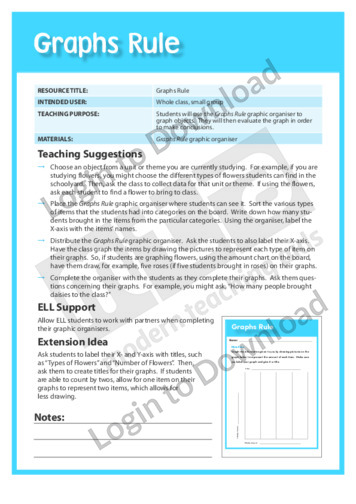
This graphic organiser, ‘Graphs Rule’ helps students to graph objects and then evaluate the graph to make conclusions.
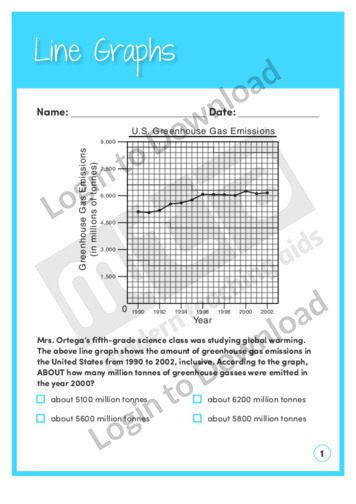
This data and probability worksheet, ‘Line Graphs 1’ allows for practice with line graphs. Answer sheet provided with file download.
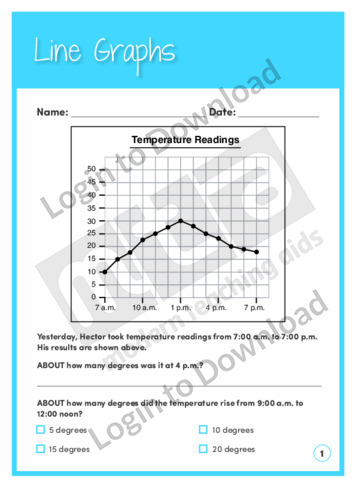
This data and probability worksheet, ‘Line Graphs 2’ allows for practice with line graphs. Answer sheet provided with file download.
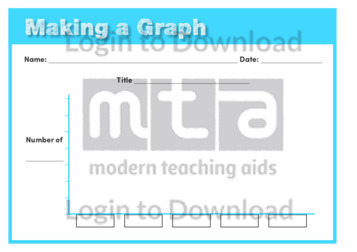
This graphic organiser, ‘Making a Graph’ supports the teaching of writing and mathematics by giving students a template for creating a graph to organise information.
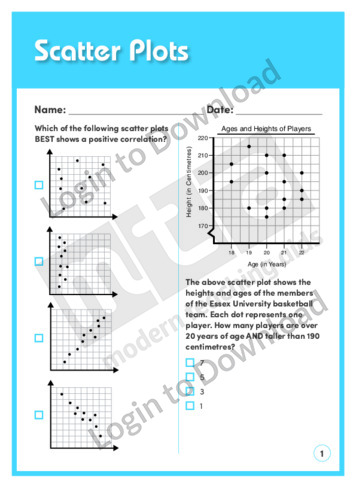
This data and probability worksheet, ‘Scatter Plots’ allows for practice with scatter plots. Answer sheet provided with file download.
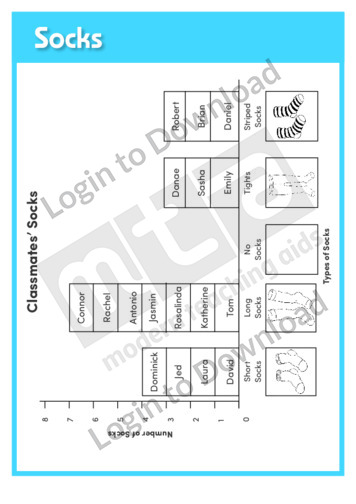
This data representation exemplar, ‘Socks’ offers an introduction to bar graphs.
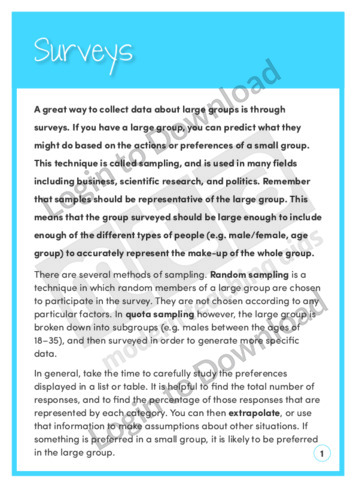
This data and probability worksheet, ‘Surveys’ offers guidance on generating data by using surveys. Answer sheet provided with file download.
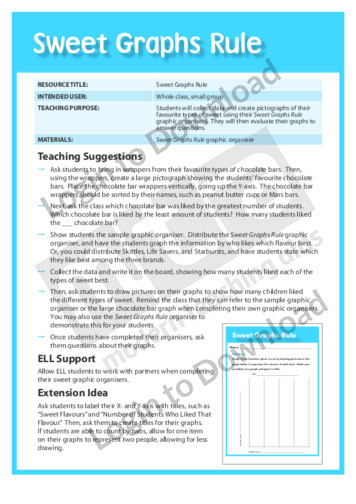
This graphic organiser, ‘Sweet Graphs Rule’ helps students to collect data a create pictographs of their favourite sweet.
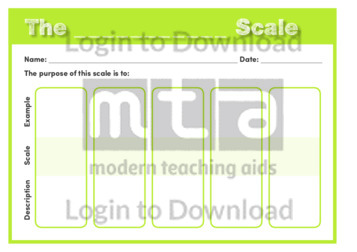
This graphic organiser, ‘The ____ Scale’ supports the teaching of writing and earth science by giving students a template for creating a scale to organise information.
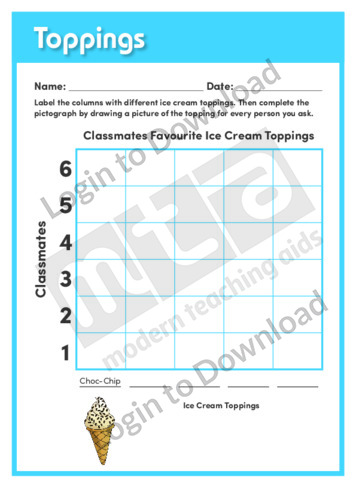
This data representation worksheet, ‘Toppings’ asks students to practise creating pictographs.
This shape template, ‘Venn Diagram’ can be reproduced for classroom use.
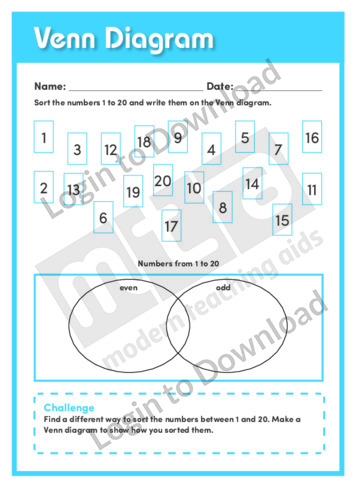
This understanding numbers worksheet, ‘Venn Diagram’ asks students to practise creating Venn Diagrams using odd and even numbers.
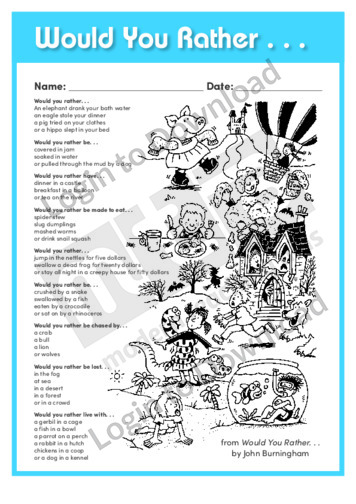
This data representation worksheet, ‘Would You Rather…’ asks students to practise creating bar graphs from hypotheses.
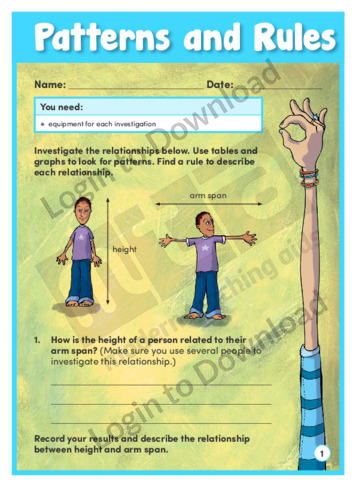
The learning activity, ‘Patterns and Rules’ contains several practical learning activities that will help students explore relationships between numbers in everyday situations. Students can select activities and compare their results with classmates. An answer sheet is provided and includes accompanying teaching notes with suggestions for supporting learning and further exploration.
It�s that easy!

