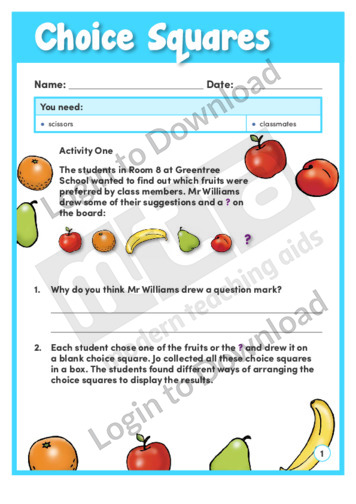
In this learning activity, ‘Choice Squares’, students use the supplied choice squares to collect data from their classmates and create graphs. By analysing the graphs, students can draw conclusions about their classmates’ preferred fruits and winter sports. An answer sheet is provided and includes teaching notes with suggestions for supporting learning and further exploration.
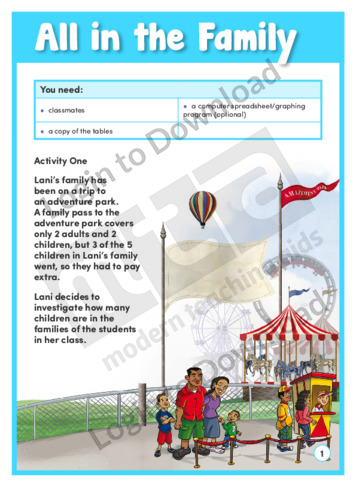
How many children do most families have? This learning activity, ‘All in the Family’ shows how a girl gathers data and represents it in different ways to compare the families in her class. Students can display and interpret her data and then gather data from their own classmates. An answer sheet is provided and includes …More
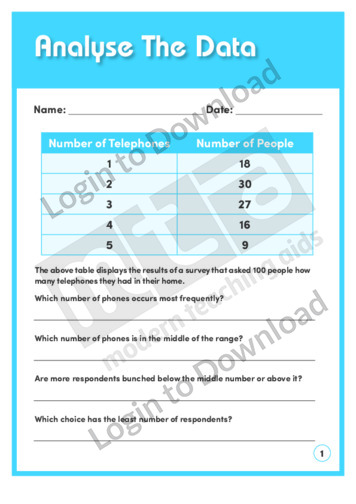
This data and probability worksheet, ‘Analyse The Data’ allows for practice analysing sets of data on graphs and tables. Answer sheet provided with file download.
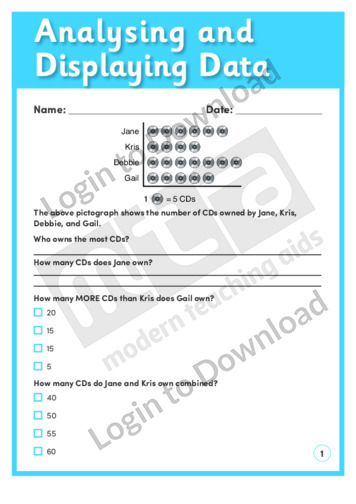
This beginning maths worksheet, ‘Analysing and Displaying Data’ allows for practice analysing everyday data. Answer sheet provided with file download.
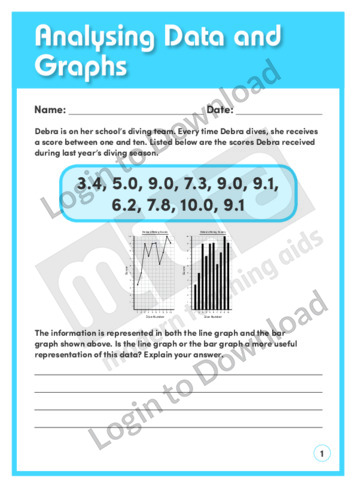
This data and probability worksheet, ‘Analysing Data and Graphs’ allows for practice accurately interpreting graphs and tables. Answer sheet provided with file download.
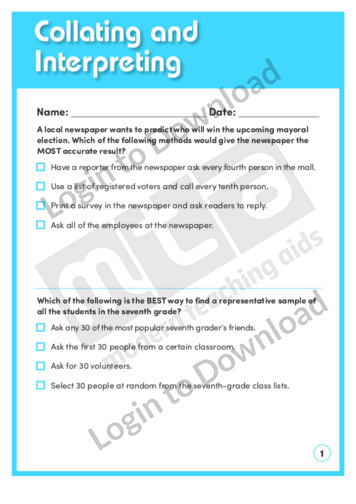
This data and probability worksheet, ‘Collating and Interpreting’ allows for practice collecting and interpreting data. Answer sheet provided with file download.
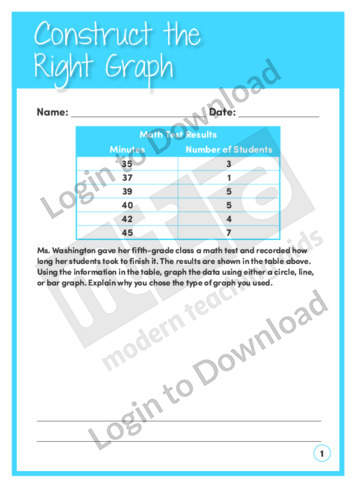
This data and probability worksheet, ‘Construct the Right Graph’ allows for practice creating and using graphs. Answer sheet provided with file download.
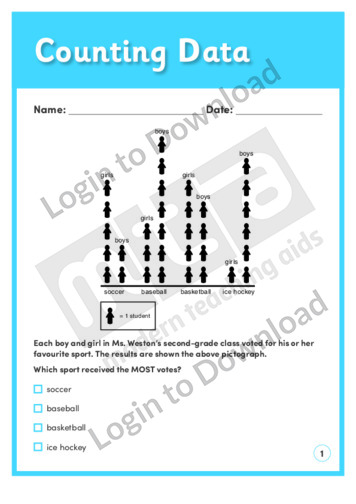
This beginning maths worksheet, ‘Counting Data’ allows for practice analysing everyday data. Answer sheet provided with file download.
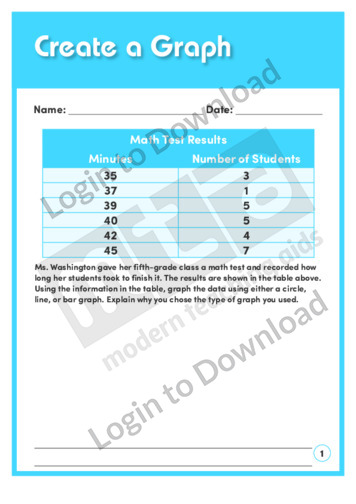
This data and probability worksheet, ‘Create a Graph’ allows for practice identifying and drawing the appropriate graph for a data set. Answer sheet provided with file download.
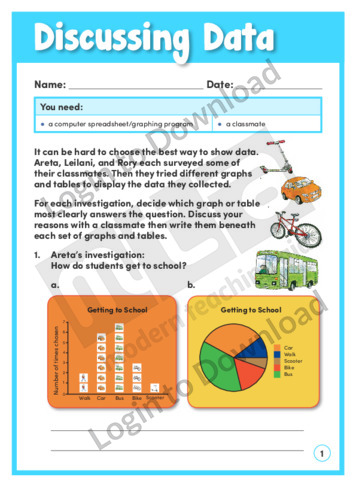
In this learning activity, ‘Discussing Data’, students must decide the best way to present different sets of data. They assess various graphs and tables and then experiment with a computer graphing program. An answer sheet is provided and includes teaching notes with suggestions for supporting learning and further exploration.
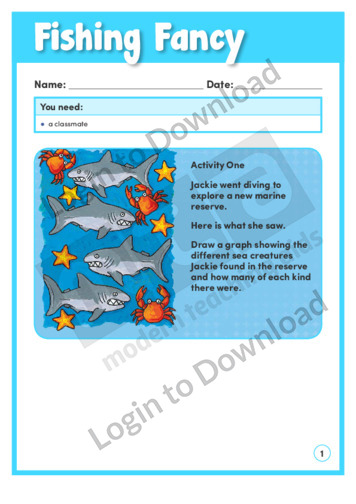
In the learning activity, ‘Fishing Fancy’, students first collect and display category data to answer questions. They then select suitable ways to display the data. They also write story problems using data and fractions as they compare the numbers of different kinds of fish. An answer sheet is provided and includes accompanying teaching notes with …More
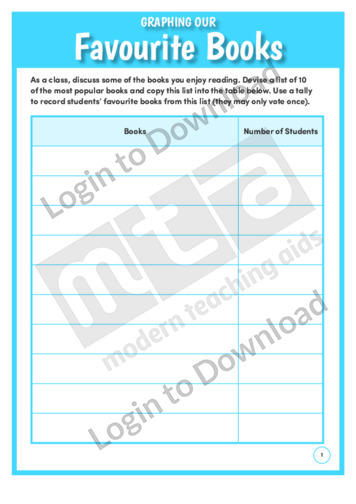
This worksheet, ‘Graphing Our Favourite Books’ is a fantastic resource to link English and mathematics. Students are asked to use tallies or numerals to record preferred books in their class. Using this table students are then provided with a graph to record their findings. The students are directed to create a bar graph however, it …More
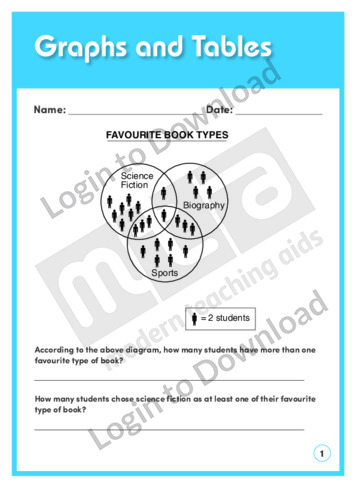
This data and probability worksheet, ‘Graphs and Tables 3’ allows for practice interpreting and analysing Venn diagrams and graphs. Answer sheet provided with file download.
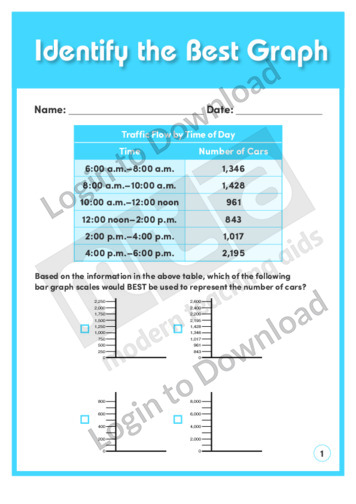
This data and probability worksheet, ‘Identify the Best Graph’ allows for practice choosing the best graph to use in a given situation. Answer sheet provided with file download.
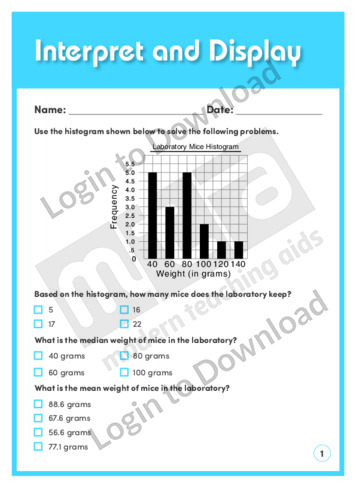
This data and probability worksheet, ‘Interpret and Display 1’ allows for practice interpreting data and creating representative graphs. Answer sheet provided with file download.
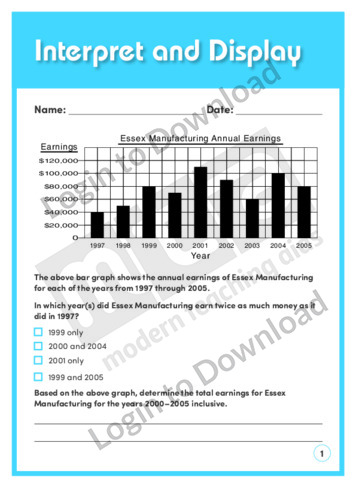
This data and probability worksheet, ‘Interpret and Display 2’ allows for practice interpreting data and creating representative graphs. Answer sheet provided with file download.
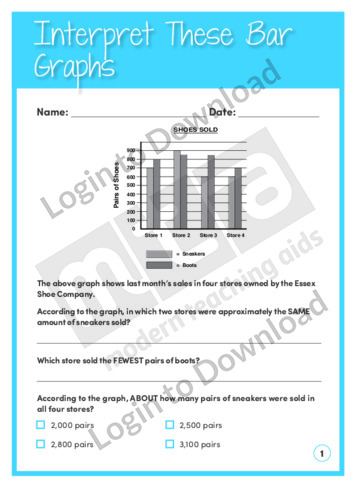
This data and probability worksheet, ‘Interpret These Bar Graphs’ allows for practice analysing bar graphs. Answer sheet provided with file download.
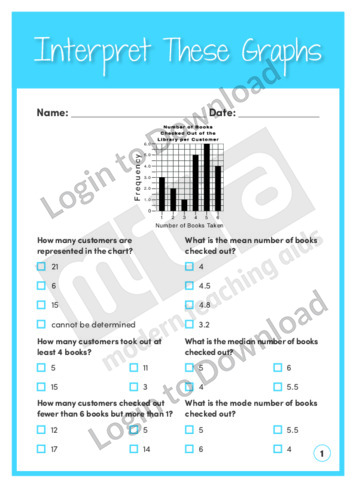
This data and probability worksheet, ‘Interpret These Graphs’ allows for practice interpreting graphs. Answer sheet provided with file download.
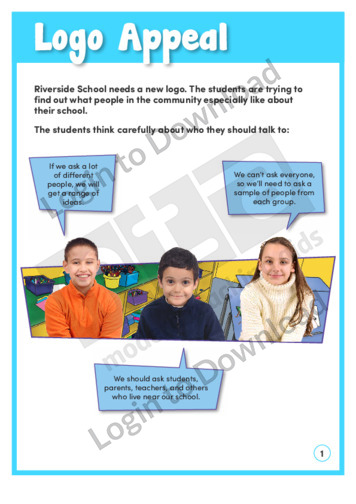
In ‘Logo Appeal’, a community survey helps the designers of Riverside School’s new logo. This learning activity introduces the statistical enquiry cycle and prompts students to use it to answer their own question. An answer sheet is provided and includes teaching notes with suggestions for supporting learning and further exploration.
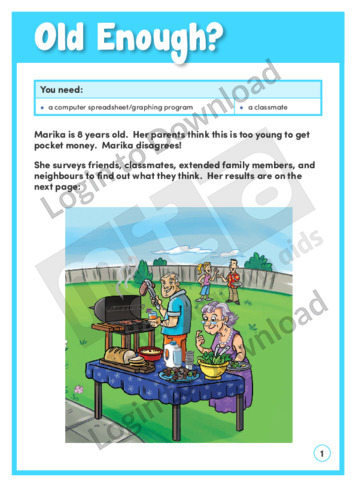
In this learning activity, ‘Old Enough?’ Marika surveys a range of people to find out the age at which children should be allowed to receive pocket money. Students display the results in a spreadsheet and interpret the data to answer questions. An answer sheet is provided and includes accompanying teaching notes with suggestions for supporting …More
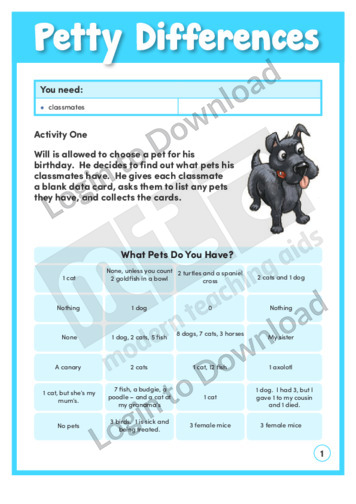
In this learning activity, ‘Petty Differences’ Will is allowed to choose a pet, so he surveys his classmates to help make his decision. Students can analyse the data he gathers then use different methods to represent and compare data. An answer sheet is provided and includes accompanying teaching notes with suggestions for supporting learning and …More
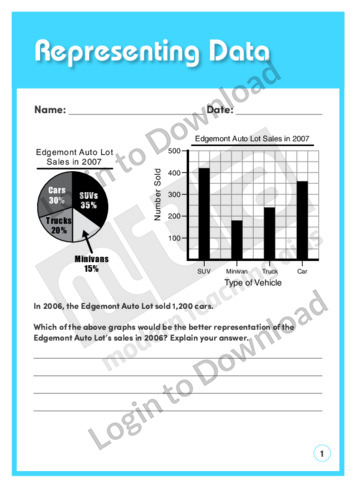
This data and probability worksheet, ‘Representing Data’ allows for practice with graphs and tables. Answer sheet provided with file download.
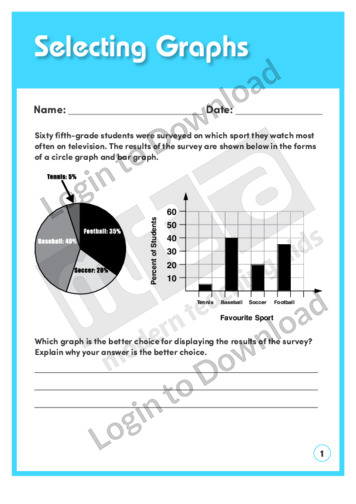
This data and probability worksheet, ‘Selecting Graphs’ allows for practice choosing the appropriate graph to use in a given situation. Answer sheet provided with file download.
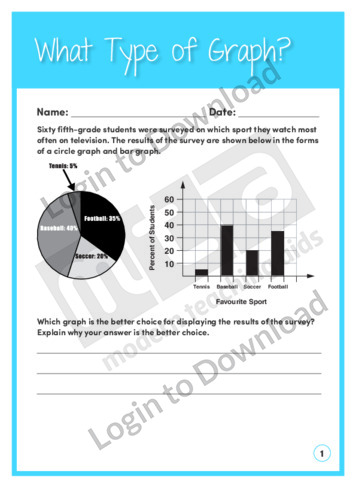
This data and probability worksheet, ‘What Type of Graph?’ allows for practice identifying the appropriateness of graphs. Answer sheet provided with file download.
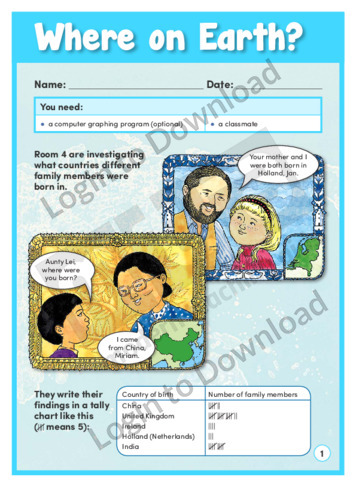
In ‘Where on Earth?’, a class investigates where different family members were born and shows the data in various graphs. The learning activity asks students to analyse the graphs and suggest improvements and then to create their own graphs. An answer sheet is provided and includes teaching notes with suggestions for supporting learning and further …More
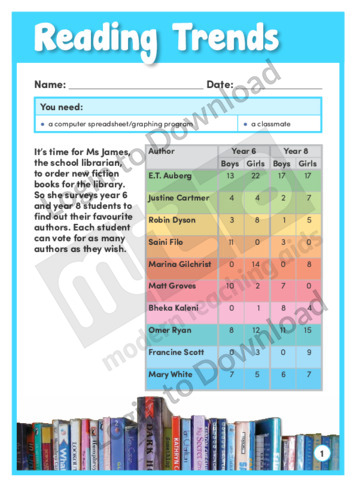
This learning activity, ‘Reading Trends’, features the results of a survey about favourite fiction authors. Students interpret various graphs and then use a computer graphing program to create their own graphs based on the data. An answer sheet is provided and includes teaching notes with suggestions for supporting learning and further exploration.
It�s that easy!

