
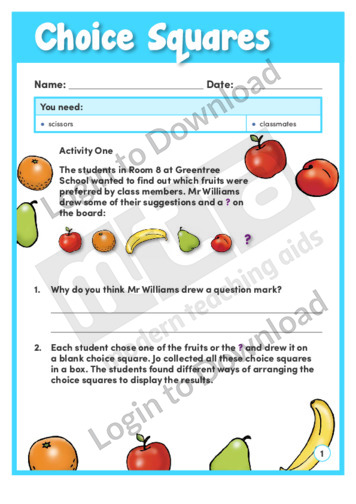
In this learning activity, ‘Choice Squares’, students use the supplied choice squares to collect data from their classmates and create graphs. By analysing the graphs, students can draw conclusions about their classmates’ preferred fruits and winter sports. An answer sheet is provided and includes teaching notes with suggestions for supporting learning and further exploration.
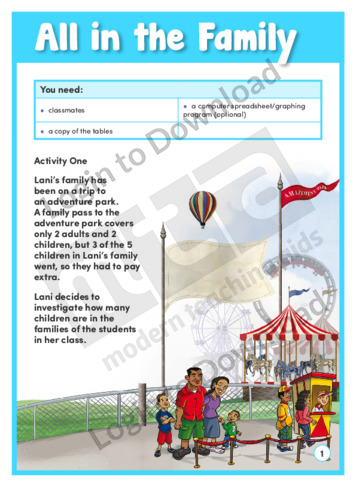
How many children do most families have? This learning activity, ‘All in the Family’ shows how a girl gathers data and represents it in different ways to compare the families in her class. Students can display and interpret her data and then gather data from their own classmates. An answer sheet is provided and includes …More
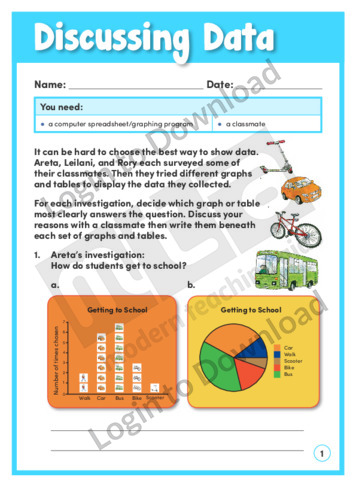
In this learning activity, ‘Discussing Data’, students must decide the best way to present different sets of data. They assess various graphs and tables and then experiment with a computer graphing program. An answer sheet is provided and includes teaching notes with suggestions for supporting learning and further exploration.
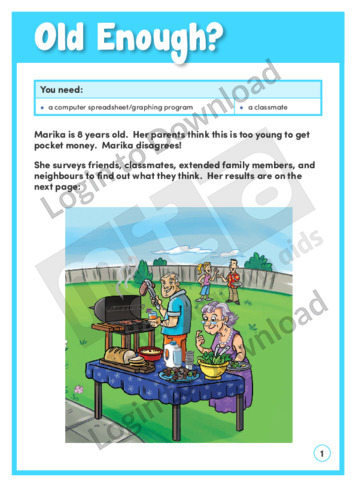
In this learning activity, ‘Old Enough?’ Marika surveys a range of people to find out the age at which children should be allowed to receive pocket money. Students display the results in a spreadsheet and interpret the data to answer questions. An answer sheet is provided and includes accompanying teaching notes with suggestions for supporting …More
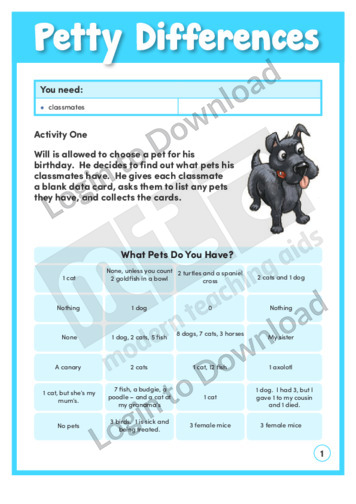
In this learning activity, ‘Petty Differences’ Will is allowed to choose a pet, so he surveys his classmates to help make his decision. Students can analyse the data he gathers then use different methods to represent and compare data. An answer sheet is provided and includes accompanying teaching notes with suggestions for supporting learning and …More
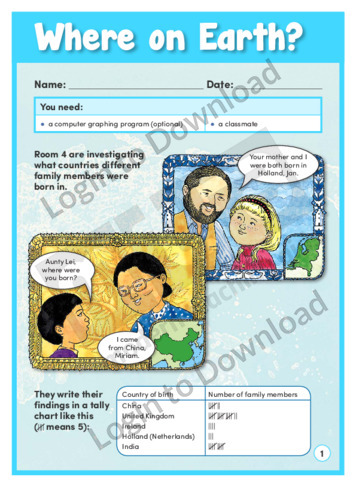
In ‘Where on Earth?’, a class investigates where different family members were born and shows the data in various graphs. The learning activity asks students to analyse the graphs and suggest improvements and then to create their own graphs. An answer sheet is provided and includes teaching notes with suggestions for supporting learning and further …More
It�s that easy!