
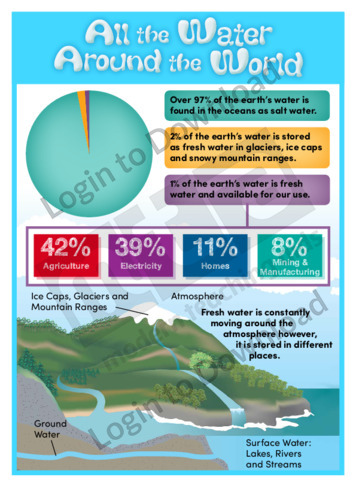
This simple infographic, ‘All the Water Around the World’ is a fantastic colourful resource that is a great addition to a unit on water collection, sanitation or the water cycle. Students are given interesting facts and figures that outline the amount of drinkable water around the world, how it is used and where it is …More
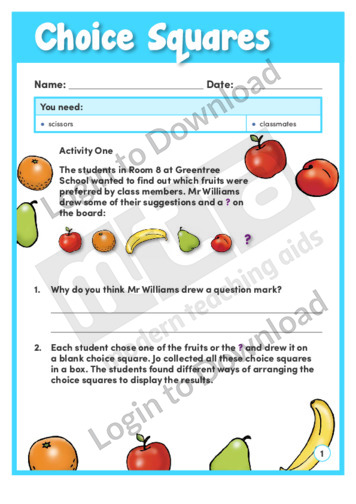
In this learning activity, ‘Choice Squares’, students use the supplied choice squares to collect data from their classmates and create graphs. By analysing the graphs, students can draw conclusions about their classmates’ preferred fruits and winter sports. An answer sheet is provided and includes teaching notes with suggestions for supporting learning and further exploration.
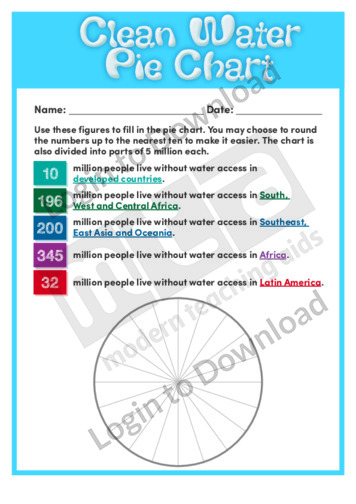
This worksheet, ‘Clean Water Pie Chart’ is a simple resource that links mathematics with a unit of water accessibility around the world. Students are provided with figures and information which they must use to complete the pie chart.
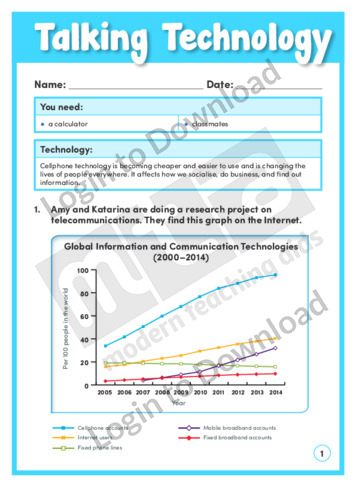
Talking Technology’ is a learning activity that will engage students in finding out just how quickly the world of ICT is changing. Students interpret graphs to make statements and predictions about the use of telecommunications. This activity includes comprehensive teaching notes to be read before beginning the activity with students, as they feature useful background …More
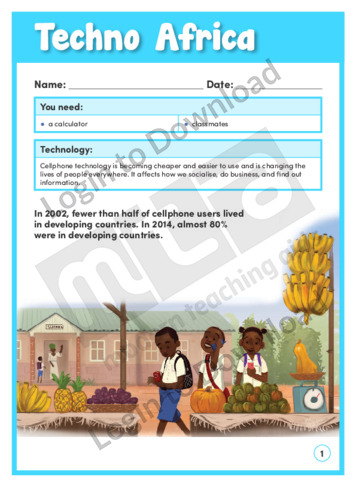
Techno Africa’ is a learning activity that engages students in understanding why cellphone usage has risen dramatically in Africa, and how this usage is helping people. This activity includes comprehensive teaching notes to be read before beginning the activity with students, as they feature useful background information and suggestions for supporting learning. An answer sheet …More
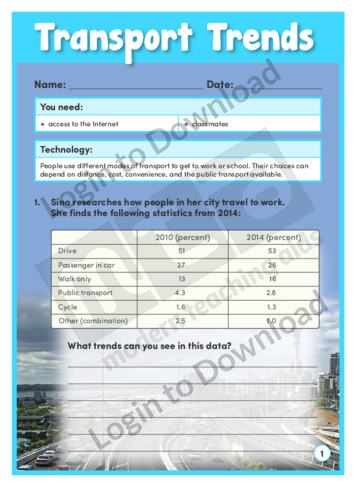
The maths activity, ‘Transport Trends’ gives students data to interpret how people use transport. They can then conduct a survey to collect data and make comparisons themselves. This activity includes comprehensive teaching notes to be read before beginning the activity with students, as they feature useful background information and suggestions for supporting learning. An answer …More
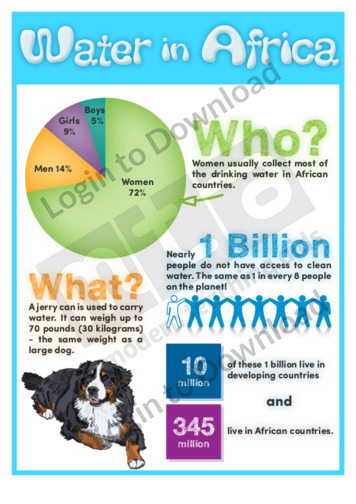
This simple infographic, ‘Water in Africa’ is a fantastic colourful resource that is a great addition to a unit on water collection or sanitation in developing countries. Students are given interesting facts and figures that outline who typically collects the drinking water, how they collect water and how many people do not have access to …More
This data representation template, ‘1/4 Inch Graph Paper’ can be reproduced for classroom use.
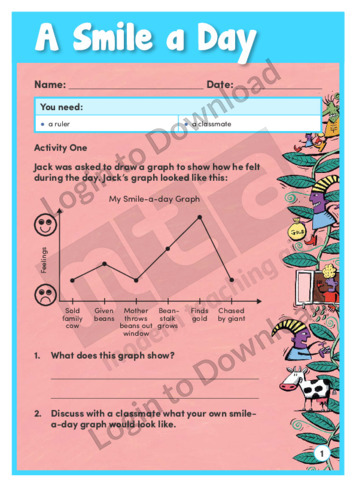
This learning activity, ‘A Smile a Day’, explores informal relations, where one of the variables is difficult to quantify. It features a graph of feelings over time and a graph template for students to complete. An answer sheet is provided and includes teaching notes with suggestions for supporting learning and further exploration.
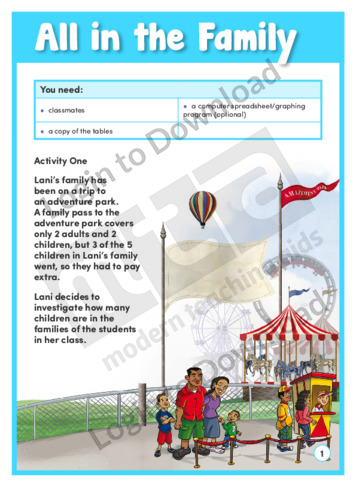
How many children do most families have? This learning activity, ‘All in the Family’ shows how a girl gathers data and represents it in different ways to compare the families in her class. Students can display and interpret her data and then gather data from their own classmates. An answer sheet is provided and includes …More
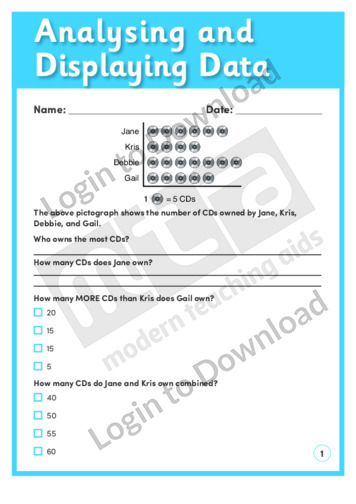
This beginning maths worksheet, ‘Analysing and Displaying Data’ allows for practice analysing everyday data. Answer sheet provided with file download.
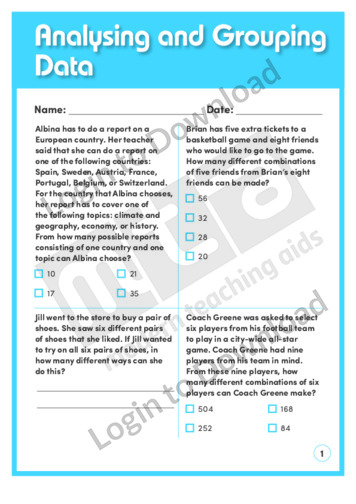
This data and probability worksheet, ‘Analysing and Grouping Data’ allows for practice collecting and displaying data to group possible outcomes. Answer sheet provided with file download.
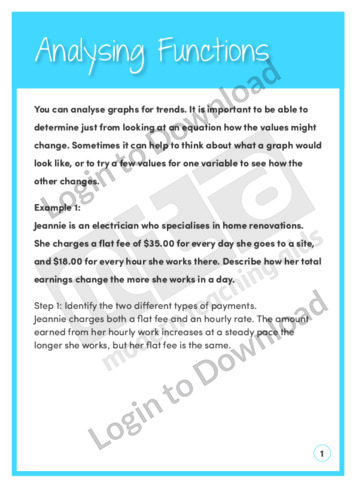
This patterns and algebra worksheet, ‘Analysing Functions’ provides opportunity to practice analysing functional relationships. Answer sheet provided with file download.
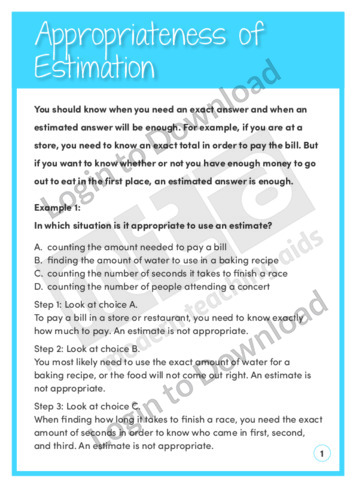
This number and numerical operations worksheet, ‘Appropriateness of Estimation’ explores the application of estimations and exact answers. Answer sheet provided with file download.
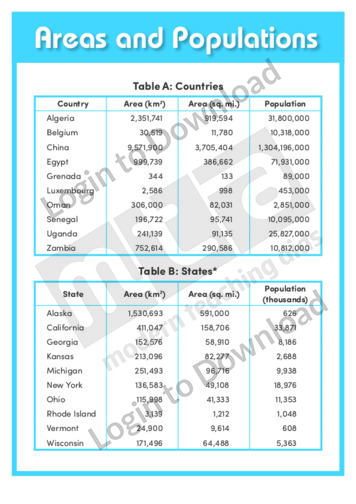
This quick reference chart, ‘Areas and Populations’ offers guidance on the topic of data interpretation.
This location and transformation template, ‘Axes’ can be reproduced for classroom use.
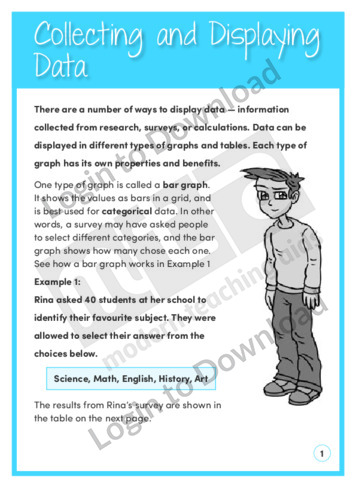
This graphic organiser, ‘Bar Graph’ is a blank grid with prompts to label both axis and the title. Bar graphs are an easy way to visualise different amounts between categories. Using this resource can assist students in graphically representing relative sizes and is also a great tool to demonstrate how bar graphs should be set-out.
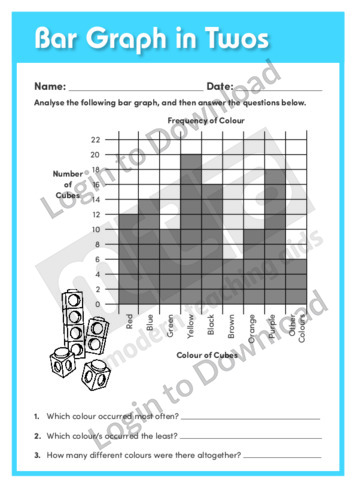
This data representation worksheet, ‘Bar Graph in Twos’ asks students to practise analysing bar graphs.
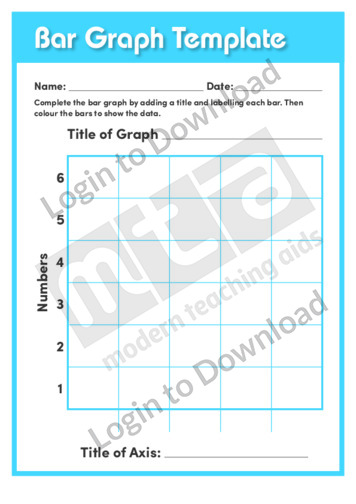
This data representation template, ‘Bar Graph Template’ can be reproduced for classroom use.
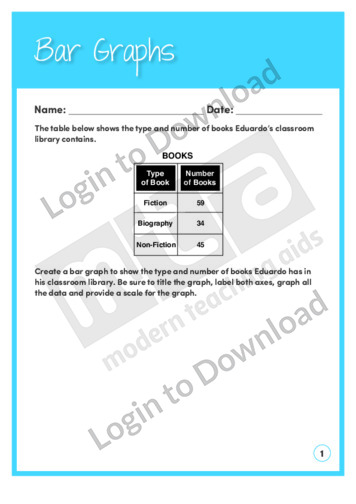
This data and probability worksheet, ‘Bar Graphs’ allows for practice graphing data. Answer sheet provided with file download.
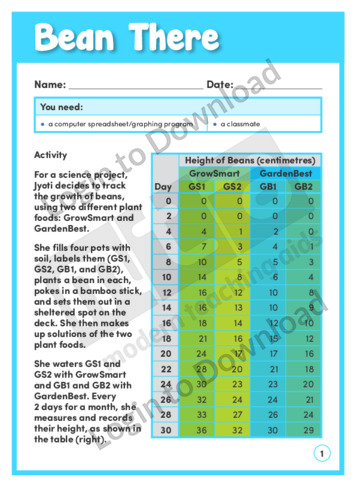
This learning activity, ‘Bean There’, features the results of a science project tracking the growth of beans using two different plant foods. Students use a computer graphing program to create a time-series graph from the data and then design and conduct their own plant food experiment. An answer sheet is provided and includes teaching notes …More
This maths template, ‘Bingo Board’ can be reproduced for classroom use.
This maths template, ‘Bingo Boards’ can be reproduced for classroom use.
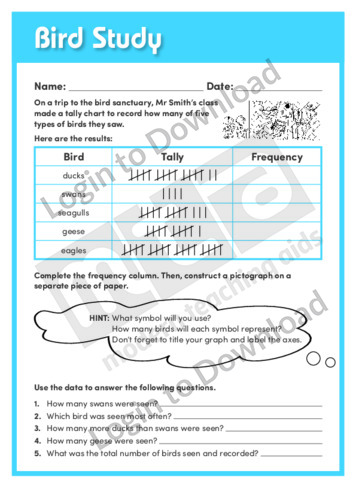
This data representation worksheet, ‘Bird Study’ asks students to practise with pictographs.
This data representation template, ‘Centimetre Graph Paper’ can be reproduced for classroom use.
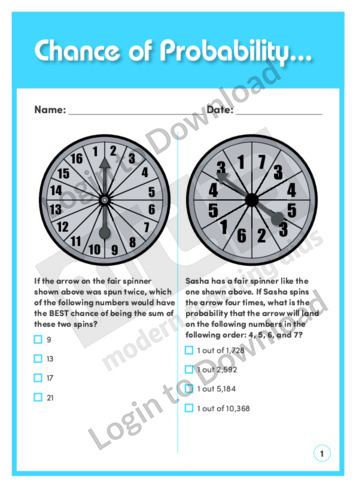
This data and probability worksheet, ‘Chance of Probability…’ allows for practice determining the probability of an event occurring. Answer sheet provided with file download.
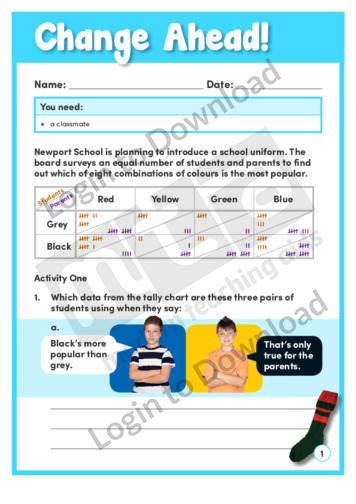
This learning activity, ‘Change Ahead!’, presents the results of a survey about school uniform colours in a tally chart and a stacked bar graph. Students interpret the data and then design a follow-up questionnaire. An answer sheet is provided and includes teaching notes with suggestions for supporting learning and further exploration.
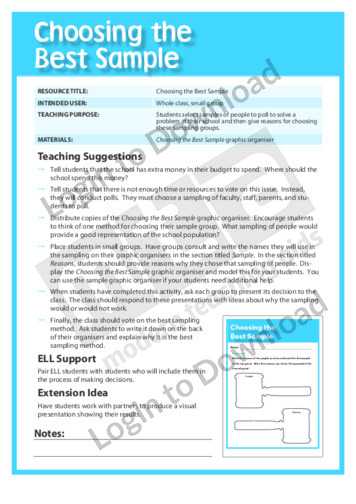
This graphic organiser, ‘Choosing the Best Sample’ asks students to select a sample of people to poll to solve a problem at their school, then give reasons for their sample selection.
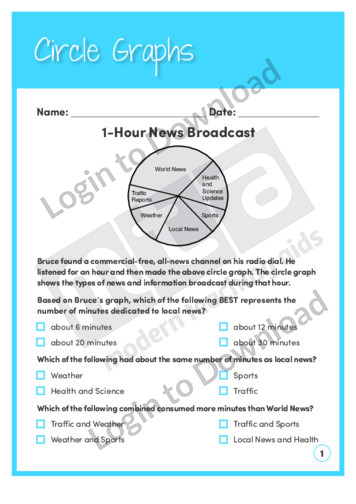
This data and probability worksheet, ‘Circle Graphs’ allows for practice with circle graphs. Answer sheet provided with file download.
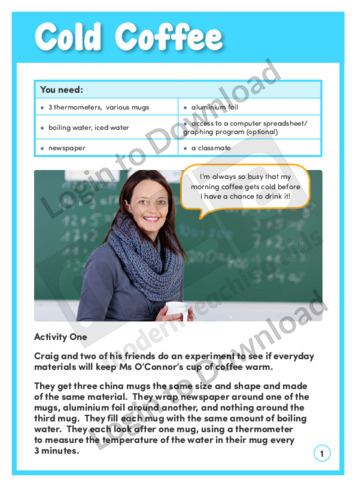
In the hands-on activity, ‘Cold Coffee’ a teacher’s complaint about her coffee sets students off on an experiment that uses data comparisons to determine the best way to keep coffee hot. By replicating the experiment, students are able to gather their own data and make predictions about the results. An answer sheet is provided and …More
This data and probability worksheet, ‘Collecting and Displaying Data’ allows for practice with collecting and displaying data. Answer sheet provided with file download.
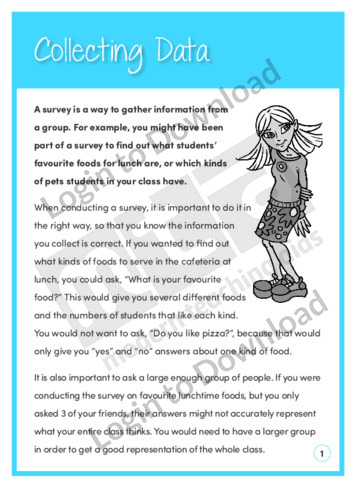
This data and probability worksheet, ‘Collecting Data’ allows for practice collecting and displaying data. Answer sheet provided with file download.
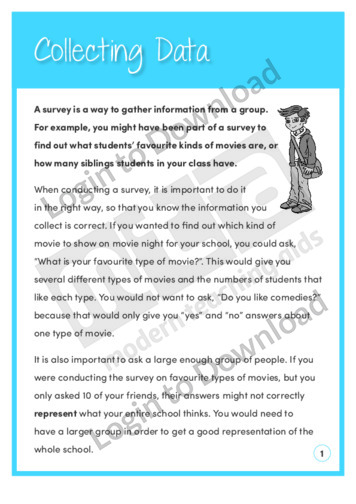
This data and probability worksheet, ‘Collecting Data’ allows for practice collecting and displaying data. Answer sheet provided with file download.
This maths manipulative, ‘Coloured Counters’ can be reproduced for classroom use.
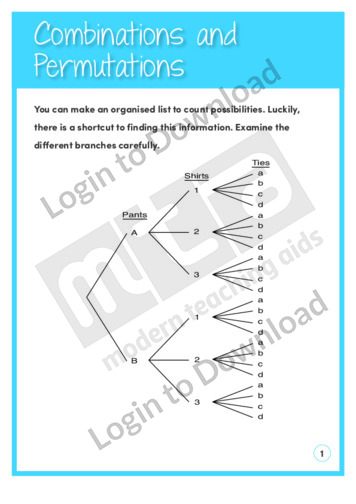
This data and probability worksheet, ‘Combinations and Permutations’ offers explanation on different principles of counting. Answer sheet provided with file download.
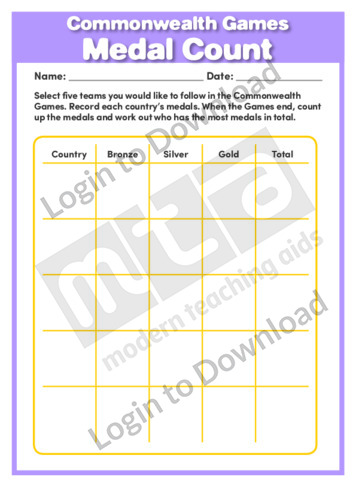
This worksheet, ‘Commonwealth Games Medal Count’ is a fantastic resource that encourages students to become involved in the progress of five countries competing in the Commonwealth Games. Students are asked to use tallies or other methods of recording data to track the gold, silver, bronze and total medal count of each country. Using this table …More
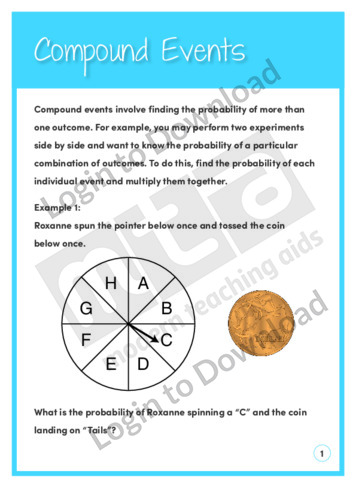
This data and probability worksheet, ‘Compound Events’ offers an introduction to compound events. Answer sheet provided with file download.
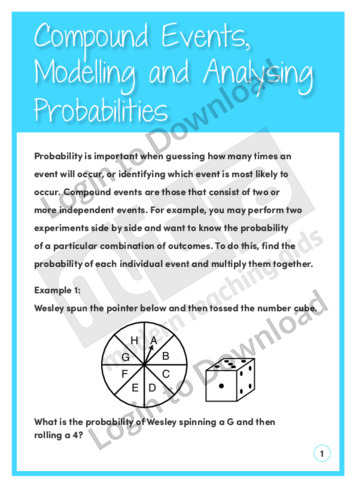
This data and probability worksheet, ‘Compound Events, Modelling and Analysing Probabilities’ offers explanation on determining the probabilities of compound events, modelling situations, and analysing probability-based games. Answer sheet provided with file download.
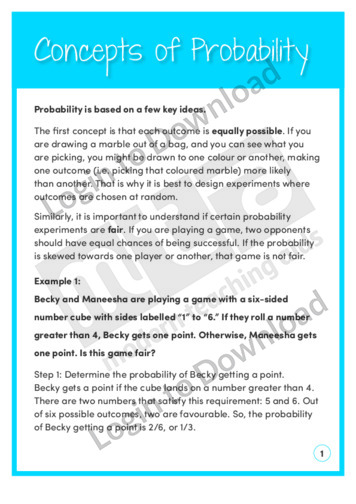
This data and probability worksheet, ‘Concepts of Probability’ offers explanation on different concepts of probability. Answer sheet provided with file download.
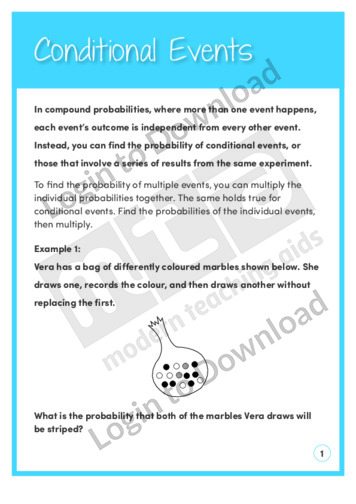
This data and probability worksheet, ‘Conditional Events’ offers guidance on exploring the probabilities of conditional events. Answer sheet provided with file download.
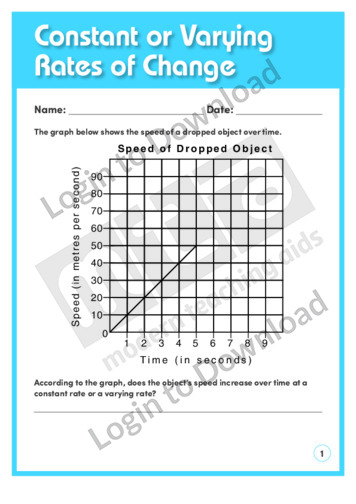
This patterns and algebra worksheet, ‘Constant or Varying Rates of Change’ allows for practice with rates of change on a graph. Answer sheet provided with file download.
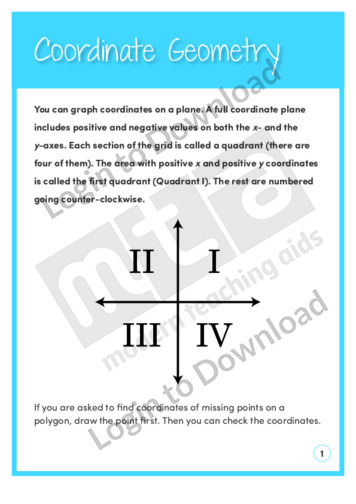
This geometry and measurement worksheet, ‘Coordinate Geometry’ allows for practice using coordinates in four quadrants to represent geometric concepts. Answer sheet provided with file download.
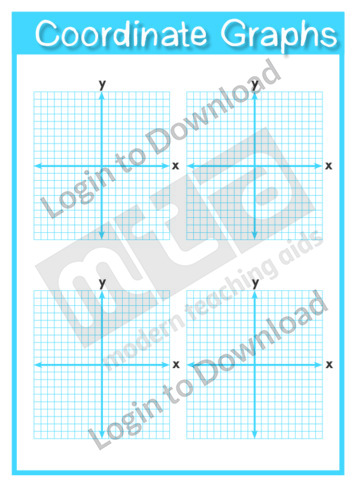
This maths template, ‘Coordinate Graphs’ can be reproduced for classroom use.
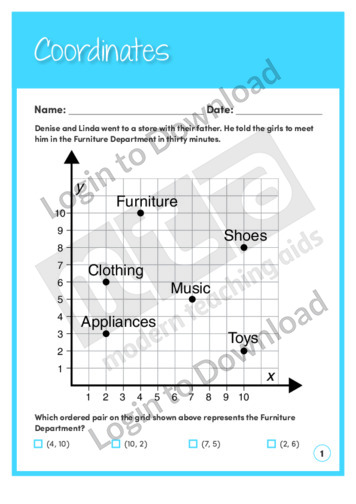
This measurement worksheet, ‘Coordinates 1’ allows for practice reading and plotting coordinate grids. Answer sheet provided with file download.
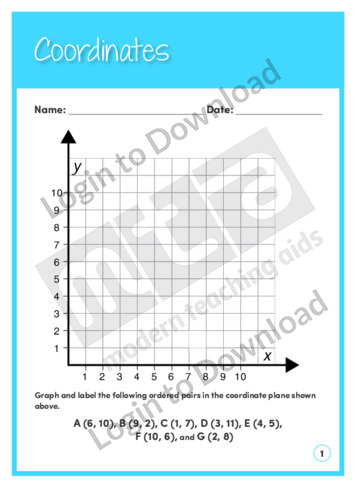
This measurement worksheet, ‘Coordinates 1’ allows for practice reading and plotting coordinate grids. Answer sheet provided with file download.
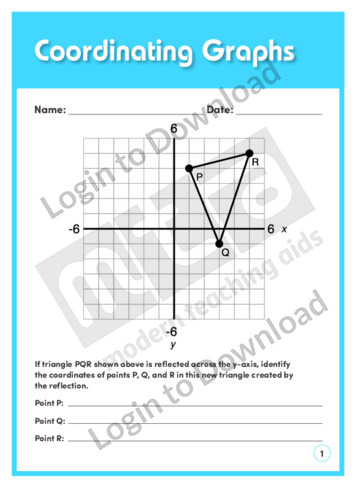
This geometry and spatial sense worksheet, ‘Coordinating Graphs’ allows for practice graphing points on a coordinate grid. Answer sheet provided with file download.
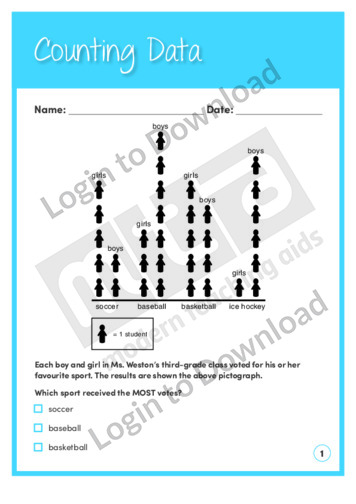
This beginning maths worksheet, ‘Counting Data’ allows for practice analysing everyday data. Answer sheet provided with file download.
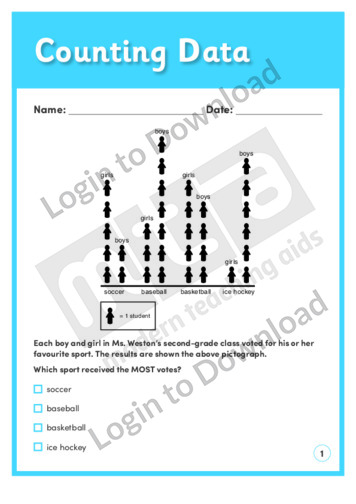
This beginning maths worksheet, ‘Counting Data’ allows for practice reading pictographs. Answer sheet provided with file download.
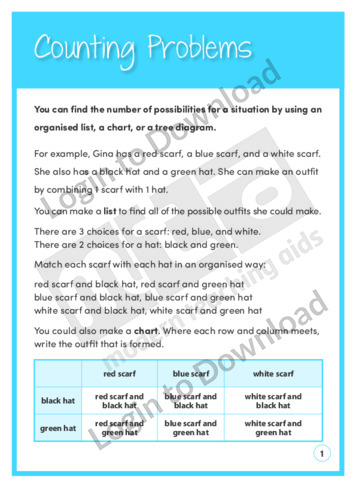
This data and probability worksheet, ‘Counting Problems’ allows for practice solving counting problems. Answer sheet provided with file download.
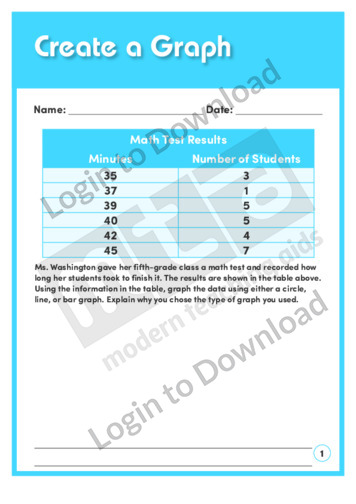
This data and probability worksheet, ‘Create a Graph’ allows for practice identifying and drawing the appropriate graph for a data set. Answer sheet provided with file download.
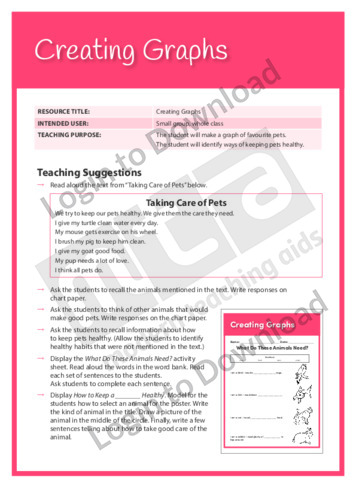
This Writing Traits activity, ‘Creating Graphs’ encourages students to practise representing data.
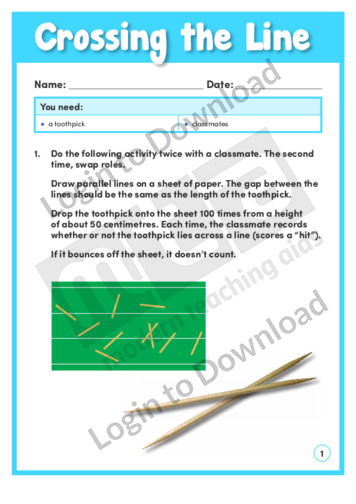
In this learning activity, ‘Crossing the Line’, students conduct an experiment known as Buffon’s Needle by dropping a toothpick onto a lined sheet of paper 100 times. Students analyse their results and express the probability of a hit as a simple fraction. An answer sheet is provided and includes teaching notes with suggestions for supporting …More
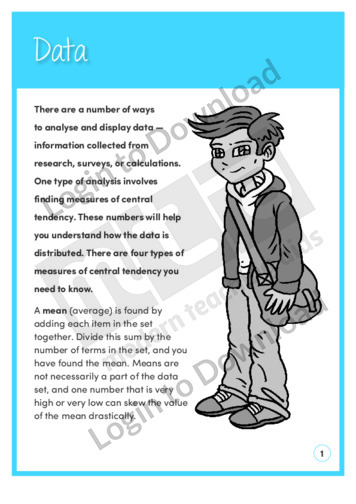
This data and probability worksheet, ‘Data’ offers guidance representing and classifying sets of data and measures of central tendency. Answer sheet provided with file download.
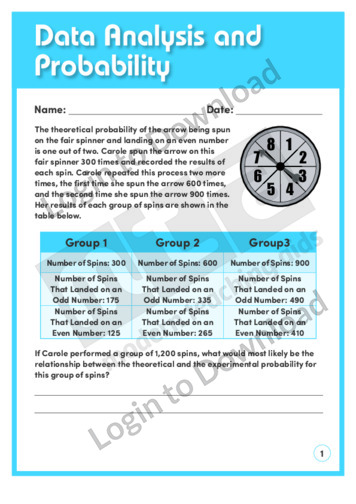
This data and probability worksheet, ‘Data Analysis and Probability’ allows for practice determining the probability of an event occurring. Answer sheet provided with file download.
This Assessment Item, ‘Test Practice: Data Analysis and Probability’ can be used to assess students’ understanding of data and probability. Answer sheet provided with file download.
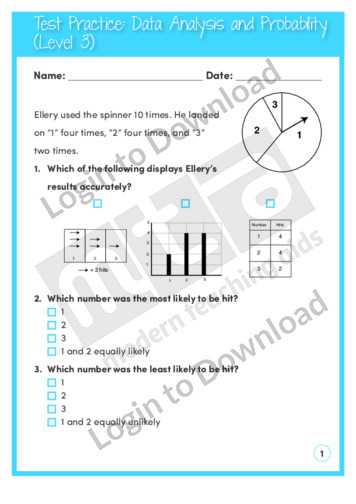
This Assessment Item, ‘Test Practice: Data Analysis and Probability’ can be used to assess students’ understanding of data and probability. Answer sheet provided with file download.
This Assessment Item, ‘Test Practice: Data Analysis and Probability’ can be used to assess students’ understanding of data and probability. Answer sheet provided with file download.
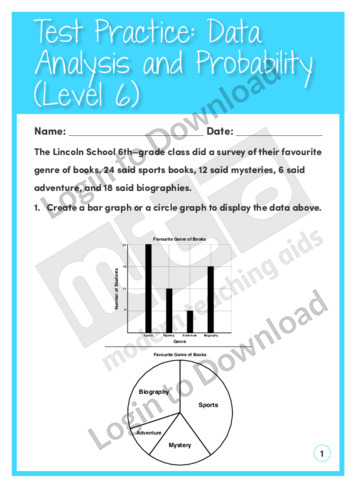
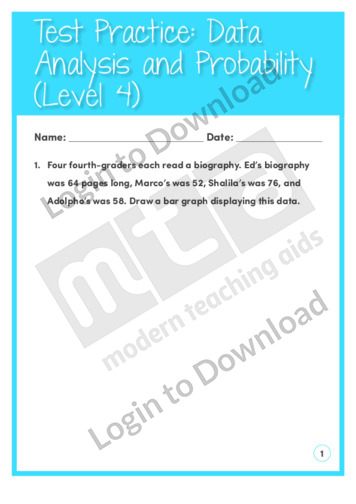
This Assessment Item, ‘Test Practice: Data Analysis and Probability’ can be used to assess students’ understanding of data and probability. Answer sheet provided with file download.
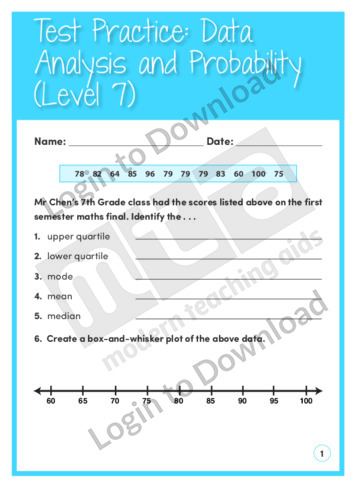
This Assessment Item, ‘Test Practice: Data Analysis and Probability’ can be used to assess students’ understanding of data and probability. Answer sheet provided with file download.
01.jpg)
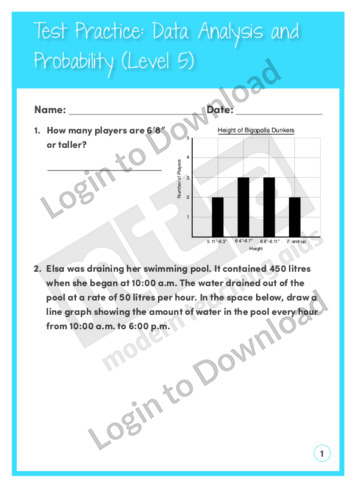
This Assessment Item, ‘Test Practice: Data Analysis and Probability’ can be used to assess students’ understanding of data and probability. Answer sheet provided with file download.
It�s that easy!