
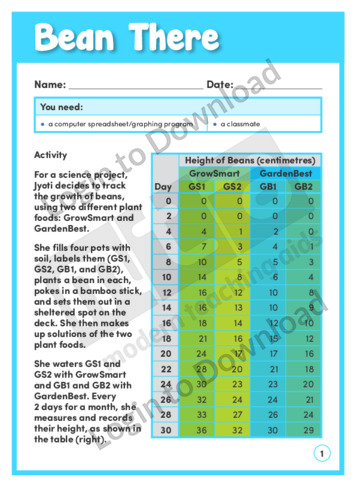
This learning activity, ‘Bean There’, features the results of a science project tracking the growth of beans using two different plant foods. Students use a computer graphing program to create a time-series graph from the data and then design and conduct their own plant food experiment. An answer sheet is provided and includes teaching notes …More
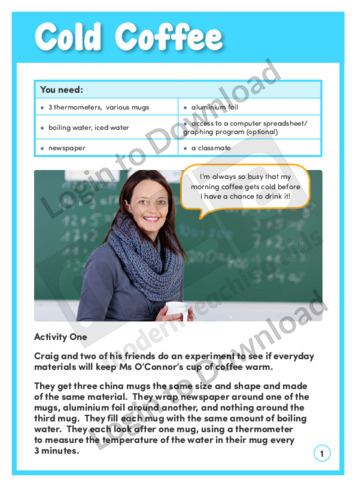
In the hands-on activity, ‘Cold Coffee’ a teacher’s complaint about her coffee sets students off on an experiment that uses data comparisons to determine the best way to keep coffee hot. By replicating the experiment, students are able to gather their own data and make predictions about the results. An answer sheet is provided and …More
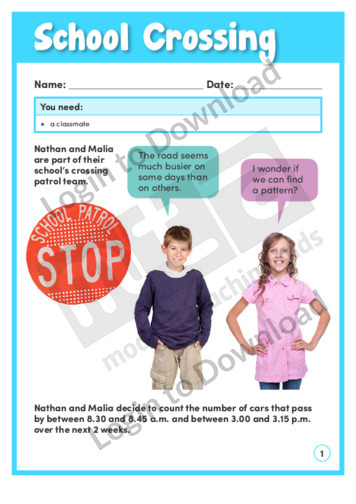
In ‘School Crossing’, Nathan and Malia are trying to find a pattern in the traffic outside their school. The learning activity asks students to interpret a time-series graph and assess the validity of statements made about it. Students then conduct their own statistical investigation. An answer sheet is provided and includes teaching notes with suggestions …More
It�s that easy!