
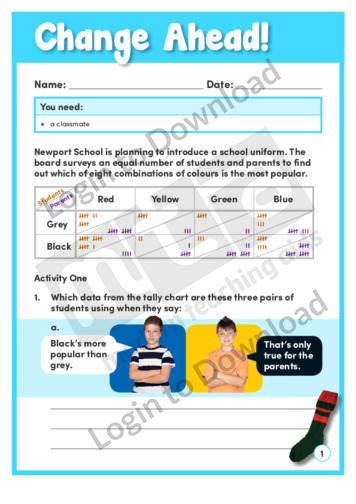
This learning activity, ‘Change Ahead!’, presents the results of a survey about school uniform colours in a tally chart and a stacked bar graph. Students interpret the data and then design a follow-up questionnaire. An answer sheet is provided and includes teaching notes with suggestions for supporting learning and further exploration.
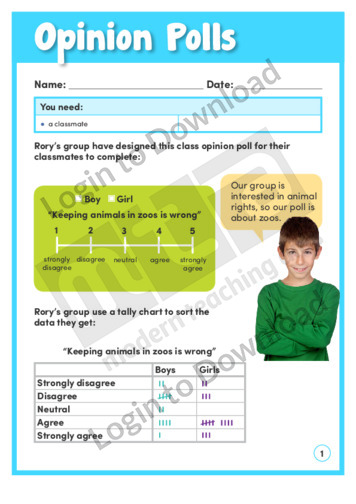
This learning activity, ‘Opinion Polls’, presents the results of an opinion poll about zoos in a variety of graphs. Students assess the data and explore the use of the Likert scale in opinion polls. An answer sheet is provided and includes teaching notes with suggestions for supporting learning and further exploration.
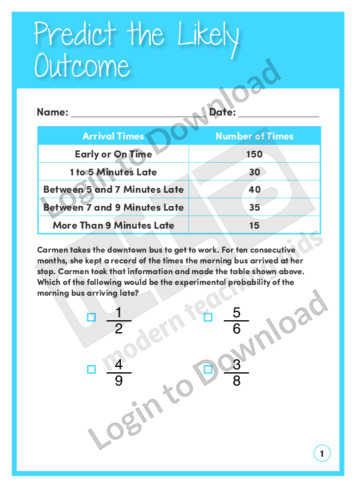
This data and probability worksheet, ‘Predict the Likely Outcome’ allows for practice predicting the probability of given situations. Answer sheet provided with file download.
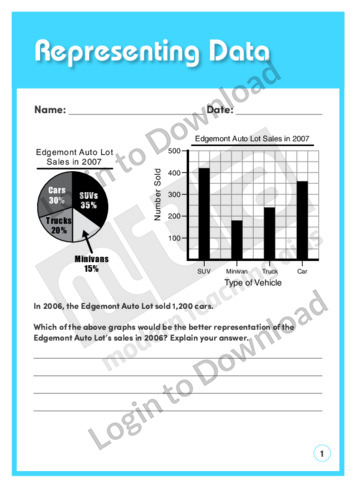
This data and probability worksheet, ‘Representing Data’ allows for practice with graphs and tables. Answer sheet provided with file download.
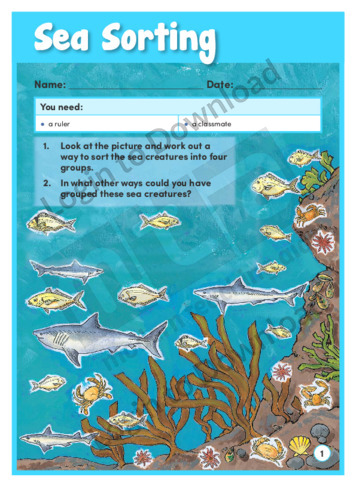
The learning activity, ‘Sea Sorting’ asks students to sort a variety of sea creatures into groups. Students make decisions about the ways they will sort and represent their data. They then write questions about their data for their classmates to solve. The activity requires an understanding of the different kinds of graphs and which ones …More
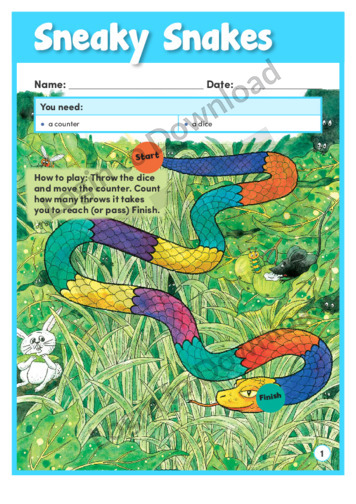
This learning activity, ‘Sneaky Snakes’, includes a board and instructions for a simple game of chance. Students play the game and record how many throws it takes to reach the finish. They then analyse the data. The accompanying teaching notes include suggestions for supporting learning and further exploration.
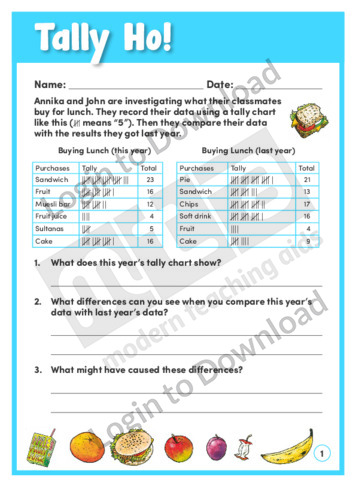
In ‘Tally Ho!’, Annika and John use tally charts to record what their classmates buy for lunch. When they compare it to last year’s data, there are some significant differences. The learning activity asks students to analyse the data and deduce the reasons for the changes. An answer sheet is provided and includes teaching notes …More
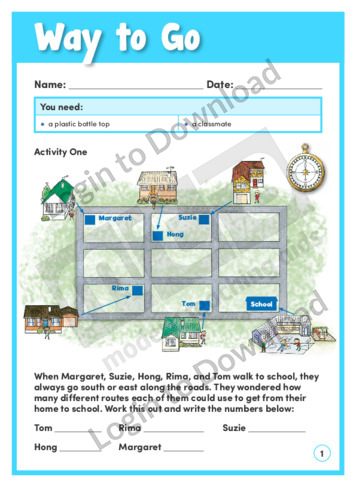
This learning activity, ‘Way to Go’, presents two activities that ask students to record and analyse outcomes. The first activity involves a map of routes to school, and the second activity describes a trial of bottle top throws. An answer sheet is provided and includes teaching notes with suggestions for supporting learning and further exploration.
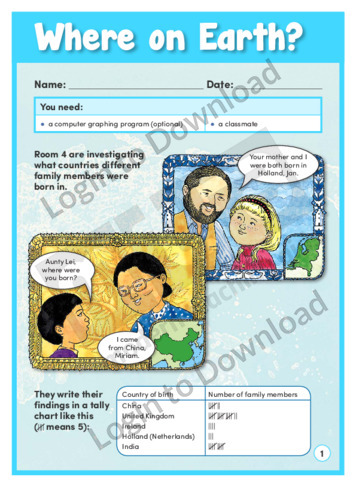
In ‘Where on Earth?’, a class investigates where different family members were born and shows the data in various graphs. The learning activity asks students to analyse the graphs and suggest improvements and then to create their own graphs. An answer sheet is provided and includes teaching notes with suggestions for supporting learning and further …More
It�s that easy!