
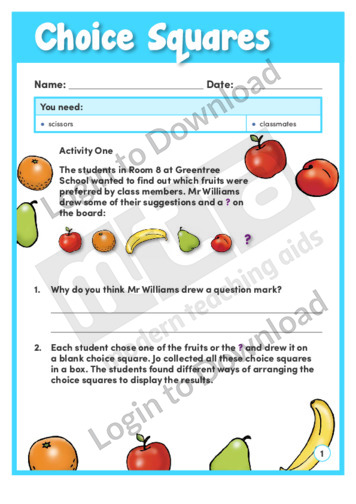
In this learning activity, ‘Choice Squares’, students use the supplied choice squares to collect data from their classmates and create graphs. By analysing the graphs, students can draw conclusions about their classmates’ preferred fruits and winter sports. An answer sheet is provided and includes teaching notes with suggestions for supporting learning and further exploration.
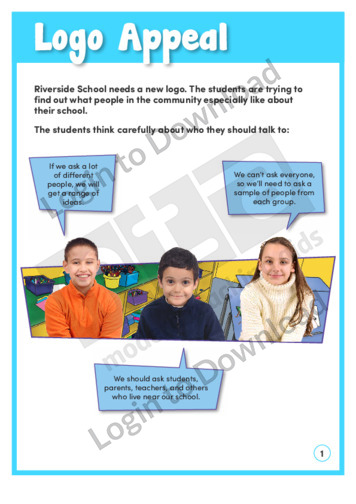
In ‘Logo Appeal’, a community survey helps the designers of Riverside School’s new logo. This learning activity introduces the statistical enquiry cycle and prompts students to use it to answer their own question. An answer sheet is provided and includes teaching notes with suggestions for supporting learning and further exploration.
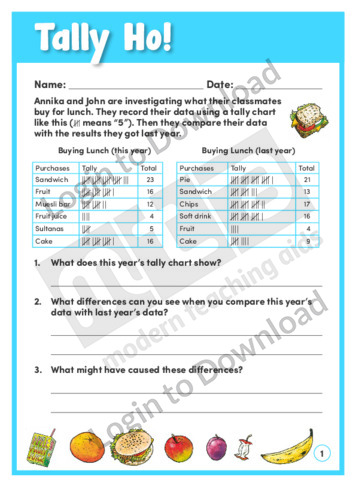
In ‘Tally Ho!’, Annika and John use tally charts to record what their classmates buy for lunch. When they compare it to last year’s data, there are some significant differences. The learning activity asks students to analyse the data and deduce the reasons for the changes. An answer sheet is provided and includes teaching notes …More
It�s that easy!