
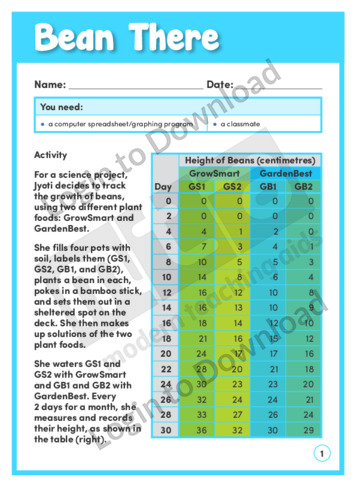
This learning activity, ‘Bean There’, features the results of a science project tracking the growth of beans using two different plant foods. Students use a computer graphing program to create a time-series graph from the data and then design and conduct their own plant food experiment. An answer sheet is provided and includes teaching notes …More
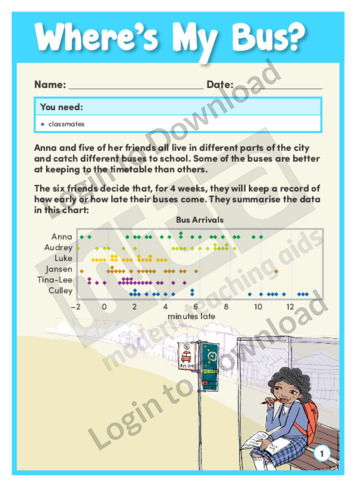
In ‘Where’s My Bus?’, six friends record how early or late their buses come. The learning activity asks students to compare six graphically presented data sets, write generalisations based on the dot plots, and decide which bus is the most reliable. An answer sheet is provided and includes teaching notes with suggestions for supporting learning …More
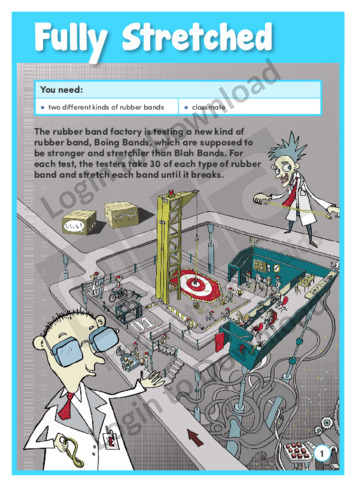
In this learning activity, ‘Fully Stretched’, students analyse the results of an experiment testing the relative strengths of two brands of rubber band. They then carry out their own rubber band comparison and graph the results. An answer sheet is provided and includes teaching notes with suggestions for supporting learning and further exploration.
It�s that easy!