
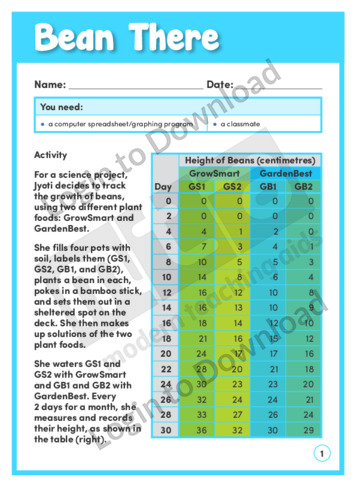
This learning activity, ‘Bean There’, features the results of a science project tracking the growth of beans using two different plant foods. Students use a computer graphing program to create a time-series graph from the data and then design and conduct their own plant food experiment. An answer sheet is provided and includes teaching notes …More
Title:
Description:
My Collections:
Error: You already have a Collection with this Title
Lesson Zone Free Samples
For immediate access, just enter your name and email address.
It�s that easy!
It�s that easy!
Resource Unavailable!
The resource you wish to access is not available to your current Subscription.
If you would like access, you can upgrade your account at any time by pressing the 'Upgrade' button
located at the top right of the screen.