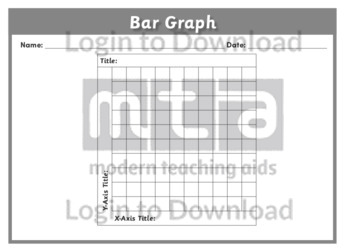
This graphic organiser, ‘Bar Graph’ is a blank grid with prompts to label both axis and the title. Bar graphs are an easy way to visualise different amounts between categories. Using this resource can assist students in graphically representing relative sizes and is also a great tool to demonstrate how bar graphs should be set-out.
Title:
Description:
My Collections:
Error: You already have a Collection with this Title
Lesson Zone Free Samples
For immediate access, just enter your name and email address.
It�s that easy!
It�s that easy!
Resource Unavailable!
The resource you wish to access is not available to your current Subscription.
If you would like access, you can upgrade your account at any time by pressing the 'Upgrade' button
located at the top right of the screen.

