Detailed description
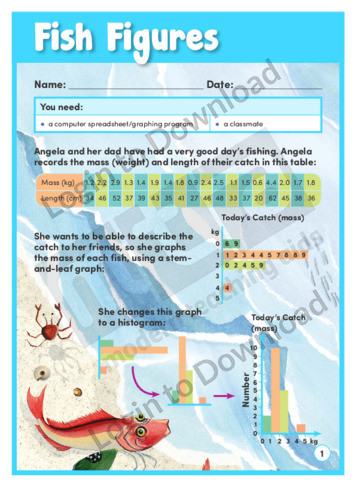
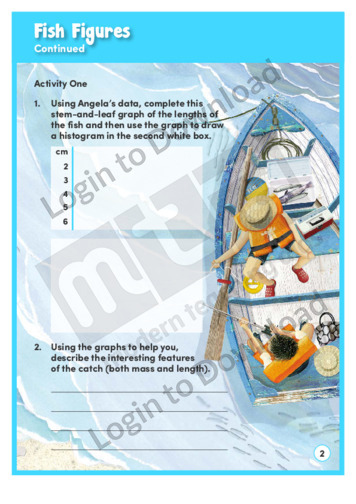
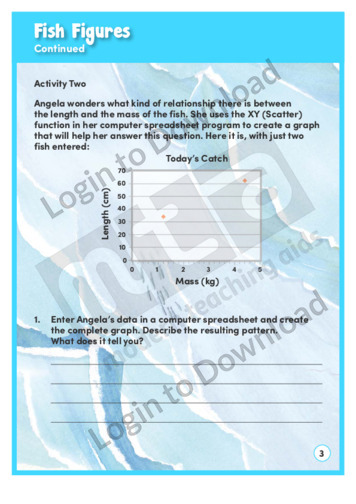
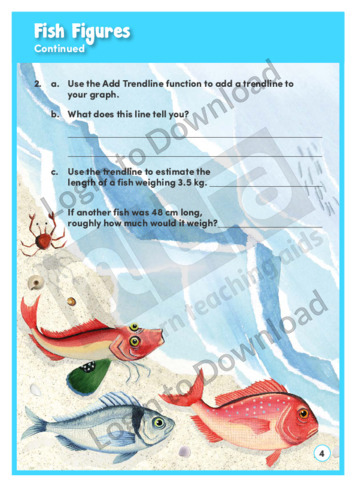
After a good day’s fishing, Angela and her dad record the mass and length of their catch. This learning activity, ‘Fish Figures’, asks students to convert stem-and-leaf graphs into histograms, create a scatter plot, and use trendlines to make predictions. An answer sheet is provided and includes teaching notes with suggestions for supporting learning and further exploration.


